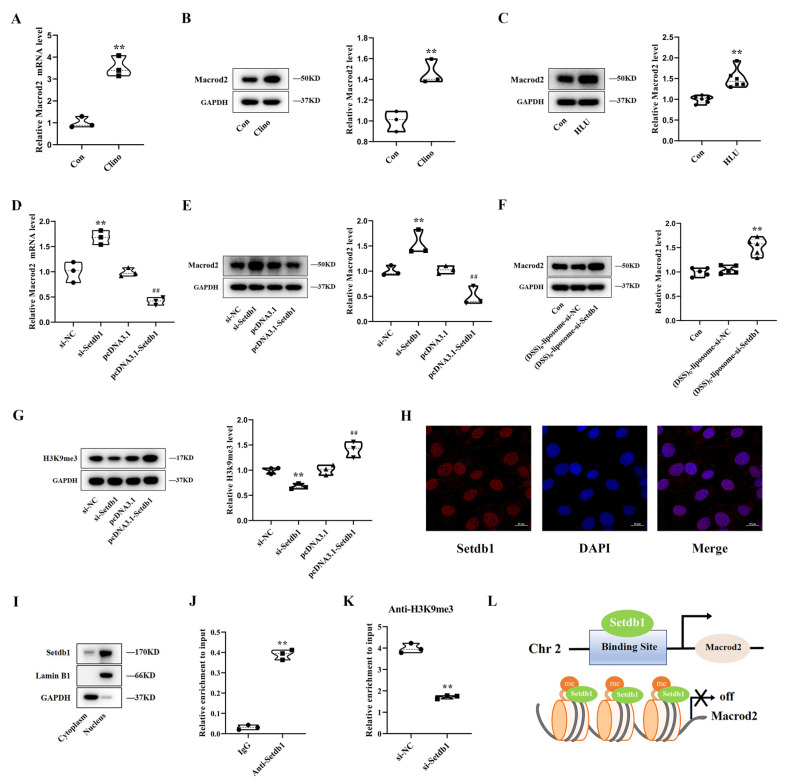
Figure 3.
Setdb1 silences Macrod2 expression by catalyzing the formation of H3K9me3 in the promoter region. (A) The mRNA level of Macrod2 in MC3T3-E1 cells after exposure to clinorotation for 48 h by qRT-PCR (n = 3). Student’s two-sided t-test. (B) Western blotting analyses of Macrod2 protein level in MC3T3-E1 cells (n = 3). Student’s two-sided t-test. (C) Protein levels of Macrod2 in hindlimb bone tissues by Western blotting in the indicated groups (n = 6). Student’s two-sided t-test. (D) qRT-PCR analysis of Macrod2 mRNA levels in MC3T3-E1 cells transfected with si-Setdb1, pcDNA3.1-Setdb1, or the corresponding controls (n = 3). One-way ANOVA followed by LSD’s multiple comparisons test. ** p < 0.01 vs. the cells transfected with si-NC. ## p < 0.01 vs. the cells transfected with pcDNA3.1. (E) Western blotting analyses of Macrod2 protein level in MC3T3-E1 cells after transfection of si-Setdb1, pcDNA3.1-Setdb1, or the corresponding controls. One-way ANOVA followed by LSD’s multiple comparisons test. ** p < 0.01 vs. the cells transfected with si-NC. ## p < 0.01 vs. the cells transfected with pcDNA3.1. (F) Protein levels of Macrod2 in bone tissues by Western blotting in the indicated groups (n = 5). One-way ANOVA followed by LSD’s multiple comparisons test. ** p < 0.01 vs. the mice injected with (DSS)6-liposome-si-NC. (G) Protein levels of H3K9me3 by Western blotting from each group (n = 3). One-way ANOVA followed by LSD’s multiple comparisons test. ** p < 0.01 vs. the cells transfected with si-NC. ## p < 0.01 vs. the cells transfected with pcDNA3.1. (H) The localization of Setdb1 was examined by immunofluorescence staining under normal conditions (n = 3). Scale bar, 20 μm. (I) The protein level of Setdb1 in cytoplasm and nucleus by Western blotting (n = 3). (J) ChIP-PCR assay illustrating Setdb1 association with the promoter of Macrod2 (n = 3). Student’s two-sided t-test. (K) ChIP-PCR assay indicating the enrichment of H3K9me3 by Setdb1 in Macrod2 promoter region (n = 3) Student’s 2-sided t test. (L) Schematic diagram of Setdb1 acting on macrod2 promoter region through formatting H3K9me3 (n = 3).

