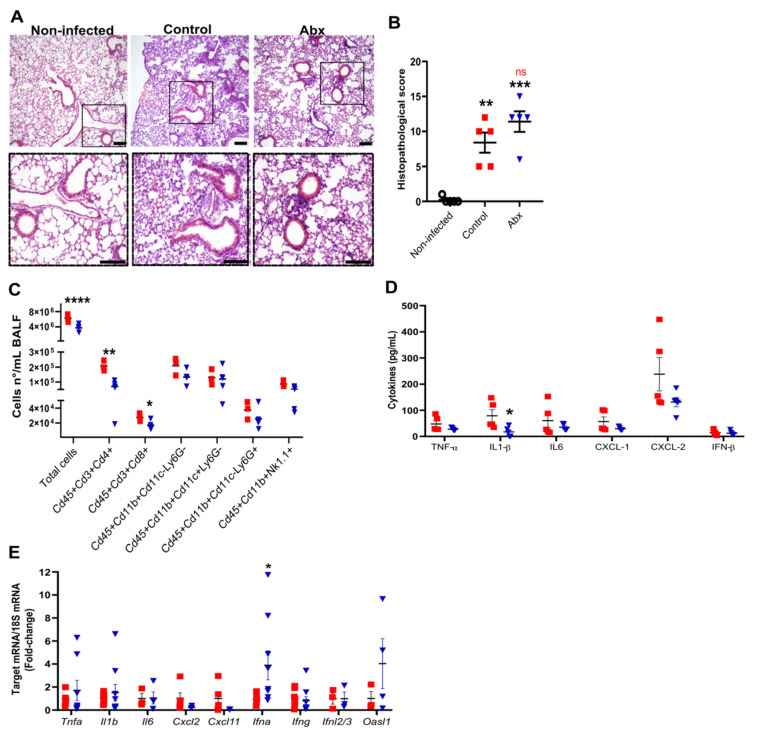
Figure 2.
Lung histological and inflammatory alterations after infection. (A) Representative images of hematoxylin and eosin staining of lung sections from each experimental group. Scale bar = 100 µm. (B) Lung histopathological scores from each experimental group. ** p < 0.005 and *** p < 0.001 by 2-way ANOVA; Sidak’s multiple comparisons test (n = 5). (C) Total cell number and differential cell counts of lymphocytes (Cd45+Cd3+Cd4+ and Cd45+Cd3+Cd8+), myeloid (monocytes Cd45+Cd11b+Cd11c−Ly6G−, dendritic cells Cd45+Cd11b+Cd11c+Ly6G− and neutrophils Cd45+Cd11b+Cd11c−Ly6G+) and NK cells (Cd45+Cd11b+NK1.1+) in BALF. **** p < 0.0001, ** p < 0.005 and * p < 0.05, Student’s t-test (n = 3–5). (D) Concentration of cytokines in lung homogenates, as measured by ELISA. * p < 0.05, Student’s t-test (n = 5). (E) Expression of inflammatory and antiviral genes quantified using RT-qPCR in lung samples. * p < 0.05, Student’s t-test (n = 3–9).

