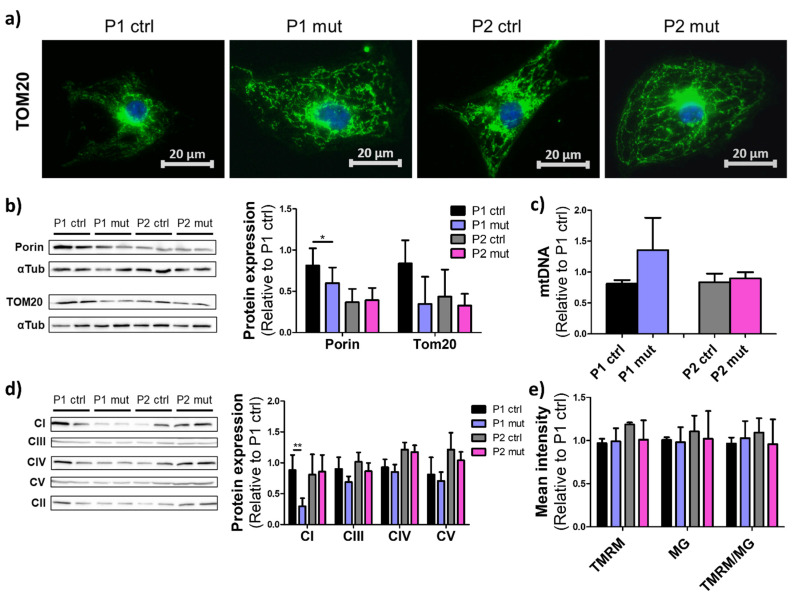
Figure 2.
Mitochondrial mutations did not induce changes in mitochondrial mass or morphology. (a) Mitochondrial morphology presented with immunostaining of mitochondrial import receptor subunit TOM20 (green) in iPSC-CMs, representative images. Nuclear counter staining with DAPI (blue). Scalebars 20 µm. (b) Western blot analysis of mitochondrial membrane proteins Porin and TOM20. Normalization to α-Tubulin (αTub) protein levels, relative to one P1 ctrl line. Representative images and quantification of the data from 4 (Porin, n = 8) or 2 (TOM20, n = 4) independent blots. (c) mtDNA copy number analyzed by qPCR and normalized against nuclear DNA. Relative results to one P1 ctrl line, three independent experiments, n = 6. (d) Western blot analysis for mitochondrial respiratory chain proteins with CI, CIII, CIV, and CV levels normalized against CII levels. Analysis relative to one P1 ctrl line. Quantification from 3 independent blots, n = 6. Significant reduction of CI level is seen in mutant P1 cells. (e) Mean intensity of mitochondrial membrane potential marker TMRM (Tetramethylrhodamine), mitochondrial mass marker MG (MitoGreen) and their ratio in iPSC-CMs analyzed with flow cytometry. Three independent experiments, n = 6. * p < 0.05 ** p < 0.01. All results are shown as mean +/− SD.

