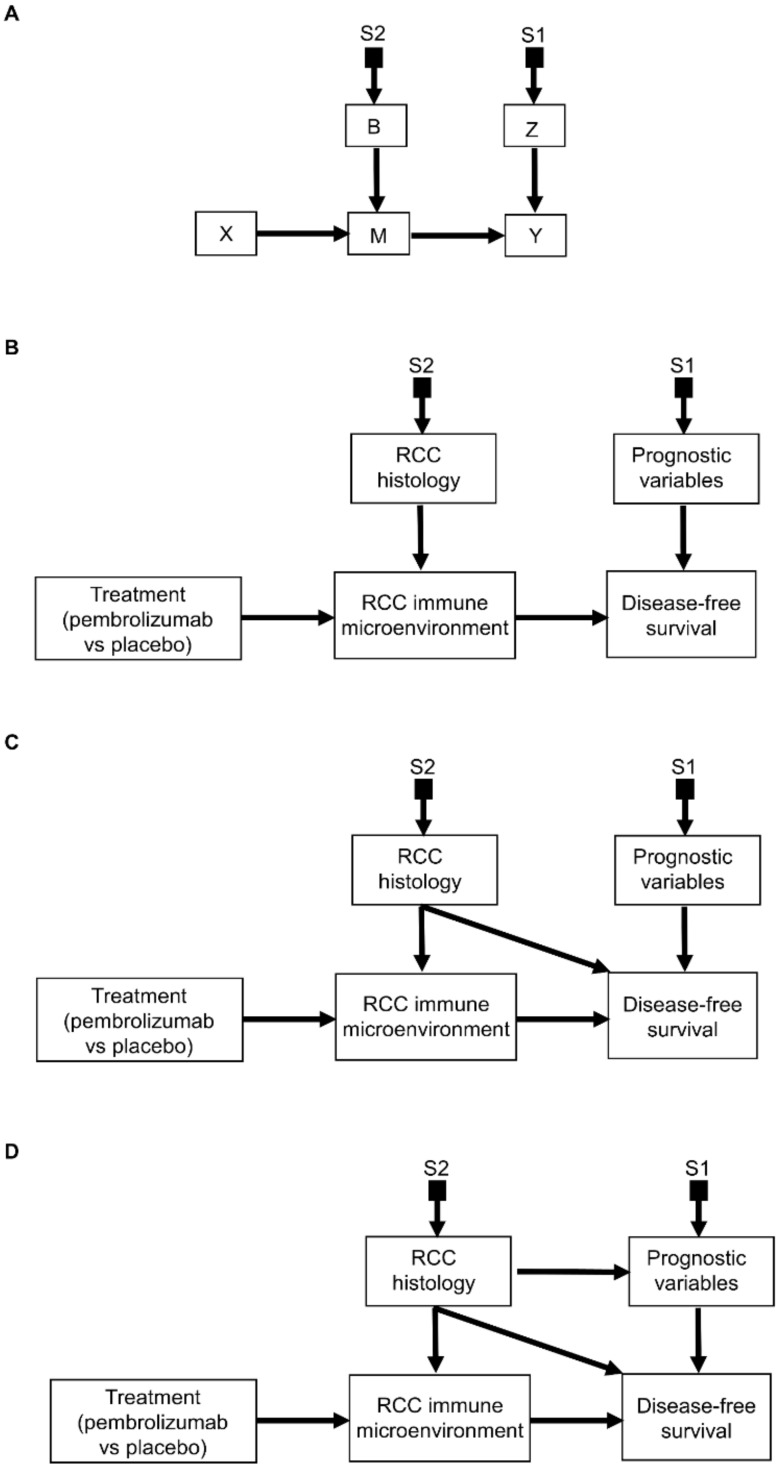
Figure 8.
Selection diagrams representing a general framework for treatment effect heterogeneity modeling: (A) Selection diagram combining both risk modeling and biological treatment effect modification. Patient populations may differ in baseline risk, denoted by the selection node S1, and/or biomarkers B that affect biological mediators M of the treatment effect, as denoted by the selection node S2; (B) Corresponding clinical scenario where risk and effect modeling may be used alone or in combination depending on the characteristics of each patient seen in the clinic. Patient populations may differ in baseline DFS risk, denoted by the selection node S1, and/or RCC histology, as denoted by the selection node S2. The S-admissibility criterion for this scenario remains the same even in the more complex scenario whereby the RCC histology also directly influences DFS as shown in (C) and the prognostic variables as shown in (D).

