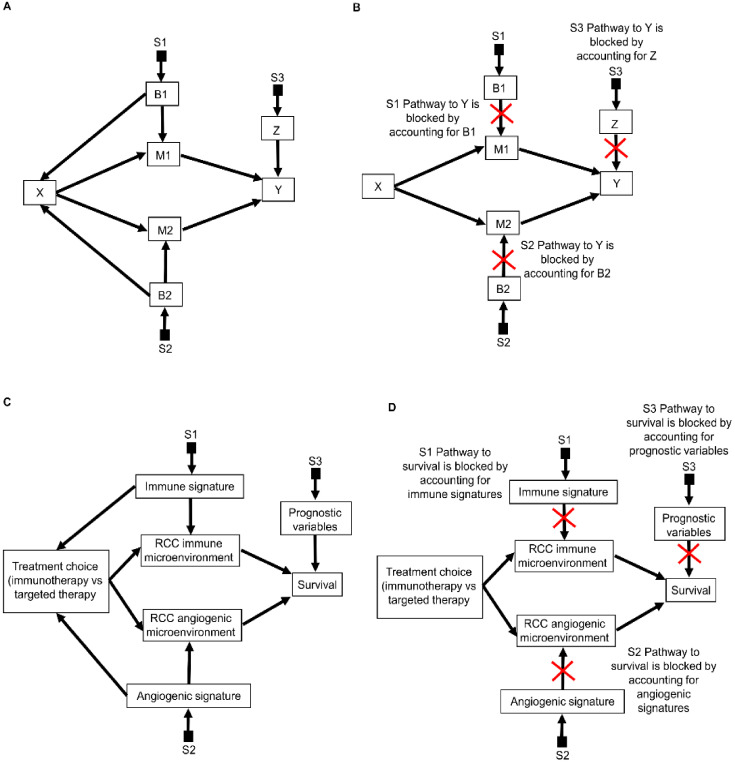
Figure 9.
Selection diagrams representing more complex scenarios of treatment effect heterogeneity: (A) The effect of treatment choice X on the outcome Y is mediated by two mediators, M1 and M2, which are influenced by biomarkers B1 and B2, respectively. Prognostic variables Z also independently influence the outcome Y. B1 and B2 also influence the treatment choice X. Patient populations may differ in B1 (denoted by S1), B2 (denoted by S2) and in Z (denoted by S3); (B) The same selection diagram modified to illustrate the considerations behind the S-admissibility criterion licensing the transportation of knowledge toward the population of patients seen in the clinic. S-admissibility states that once all arrows pointing to the treatment variable X are removed, we need to covariate weight for all variables needed to block all causal pathways that transmit effects from each selection node S toward the outcome Y. In this example, covariate weighting for B1, B2, and Z, respectively, blocks the pathways (as indicated by the red crossmarks) from S1 to Y, S2 to Y, and S3 to Y; (C) Corresponding clinical scenario where patients with metastatic RCC may be treated with either immunotherapy or anti-angiogenic targeted therapy. The effect of choosing between immunotherapy or targeted therapy is mediated by the RCC immune microenvironment, influenced by a baseline biological immune signature, which shifts across studied populations as denoted by S1. The effect of choosing between the two treatments is also mediated by the RCC angiogenic microenvironment, influenced by a baseline angiogenic signature, which shifts across studied populations as denoted by S2. The two signatures also influence the treatment choice in the studied populations. The survival outcome is also independently influenced by prognostic variables which shift across populations as denoted by S3; (D) The S-admissibility criterion licenses the transportation of knowledge toward the population of patients seen in the clinic if we properly covariate weight for shifts in prognostic variables and in immune and angiogenic signatures.

