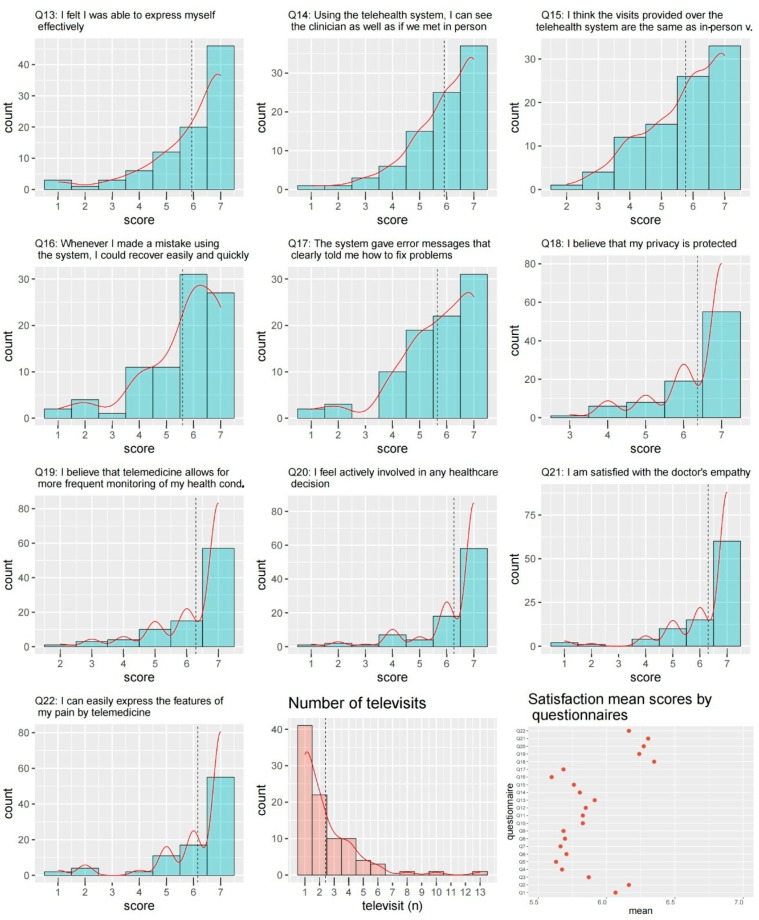
Figure 4.
Patient satisfaction questionnaire (items 13–22). The questions were answered using a 7-point Likert scale (i.e., from “strongly disagree” = 1, to “strongly agree” = 7). The dashed lines indicate the mean values. The figure also reports the number of video consultations for a patient and the mean values for each item.

