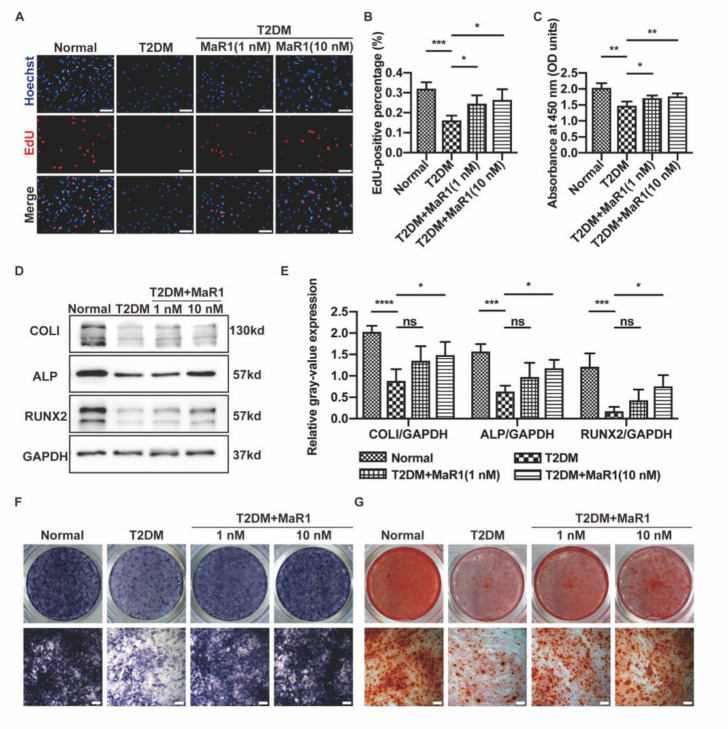
Figure 1.
MaR1 improved the proliferation and osteogenic capability of osteoblasts in T2DM conditions. (A) To assess the osteoblasts performing DNA replication, EdU staining was tested. EdU-positive nuclei (red) and all nuclei (blue). Scale bar = 100 μm. (B) The quantitative study of cells using EdU staining. (C) At the end of the second day of incubation, the Cell Counting Kit-8 assay was conducted. (D) After seven days of osteogenic induction, Western blot analysis was used to evaluate the protein levels of COLI, ALP, and RUNX2. (E) The study of the Western blot analysis quantification of gray-value expression. (F) ALP staining following a week of osteogenic induction Scale bar = 200 μm. (G) ARS staining following a 14-day osteogenic induction. Scale bar = 200 μm. Data are presented as means ± SDs from three separate experiments (n = 3). ns p > 0.05; * p < 0.05; ** p < 0.01; *** p < 0.001; **** p < 0.0001.

