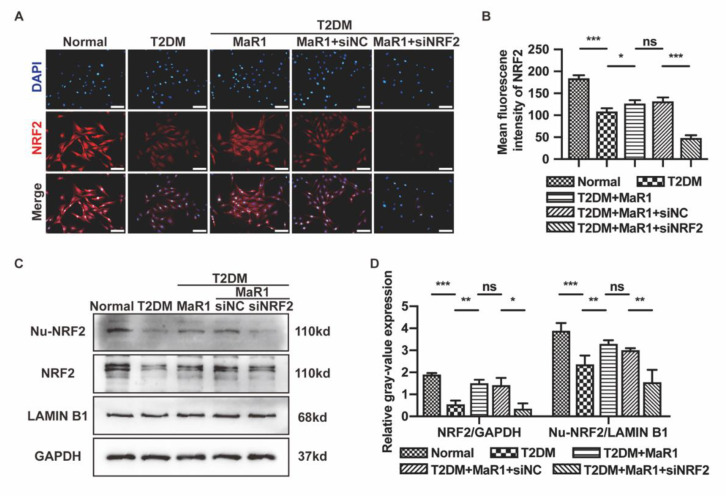
Figure 2.
MaR1 activated NRF2 signaling under T2DM conditions. (A) After three days of various stimulations, the expression of NRF2 was examined using double immunofluorescent labeling. NRF2 proteins (red) and nuclei (blue). Scale bar = 100 μm. (B) The quantitative measurement of the average NRF2 fluorescence in osteoblasts. (C) Western blotting was used to assess the protein levels of NRF2 in nuclei (Nu-NRF2) and entire cells (NRF2). (D) The quantitative analysis of the Western blotting gray-value expression. Data are presented as means ± SDs from three separate experiments (n = 3). ns p > 0.05; * p < 0.05; ** p < 0.01; *** p < 0.001. SiNC: siRNA negative control; siNRF2: siRNA of NRF2.

