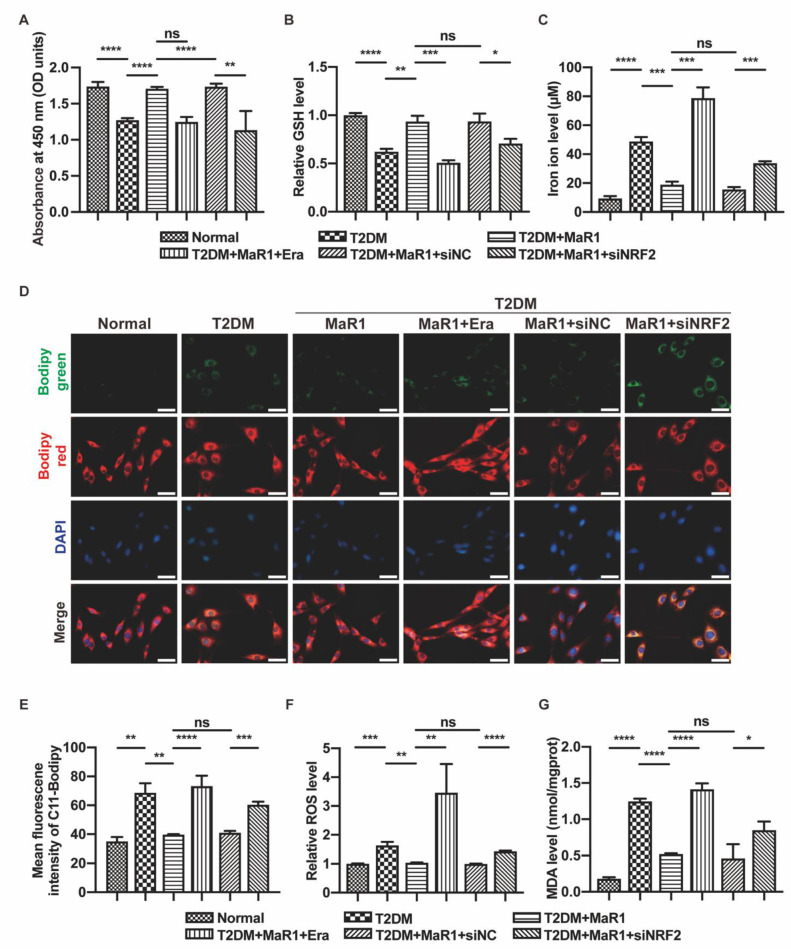
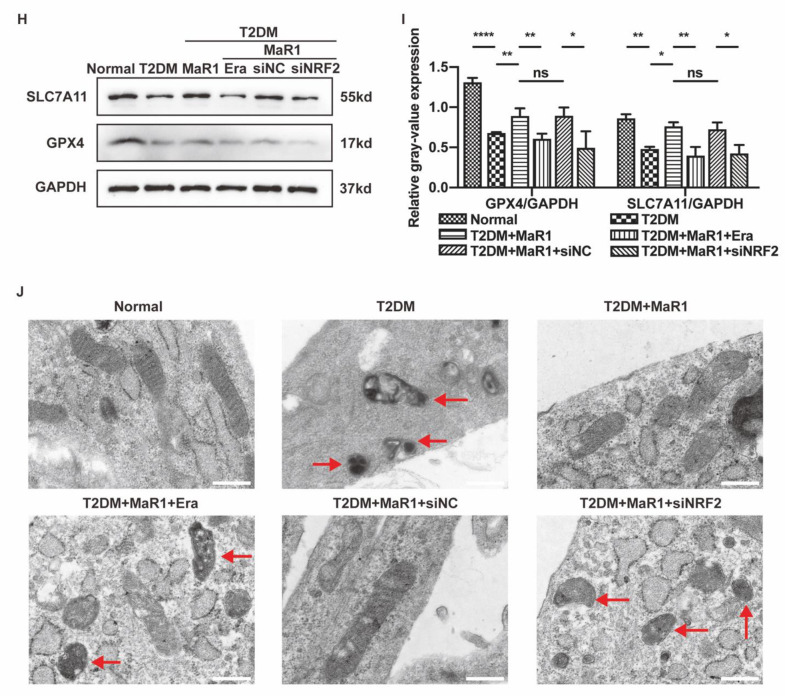
Figure 3.
MaR1 ameliorated high-glucose-induced osteoblast ferroptosis via NRF2 activation. (A) The survival of the osteoblasts was examined using the Cell Counting Kit-8 assay. (B) Level of intracellular GSH. (C) Iron ion content. (D) The lipotropic dye, the Bodipy-C11 fluorescence probe, was used to identify lipid ROS. Green, oxidized lipids; red, normal lipids; blue, all nuclei. Scale bar = 50 μm. (E) The quantitative analysis of mean Bodipy-C11 fluorescence intensity. (F) Flow cytometry was used to detect the levels of intracellular ROS. (G) A malondialdehyde assay was used to measure lipid peroxidation. (H) Western blot analysis was used to determine the protein levels of GPX4 and SLC7A11. (I) Protein level quantification and analysis. (J) Images of MC3T3-E1 cells after various treatments were taken using transmission electron microscopy. Altered mitochondria are indicated by arrows. Scale bars = 500 nm. Data are presented as means ± SDs from three independent experiments (n = 3). ns p > 0.05; * p < 0.05; ** p < 0.01; *** p < 0.001; **** p < 0.0001. SiNC: siRNA negative control; siNRF2: siRNA of NRF2.


