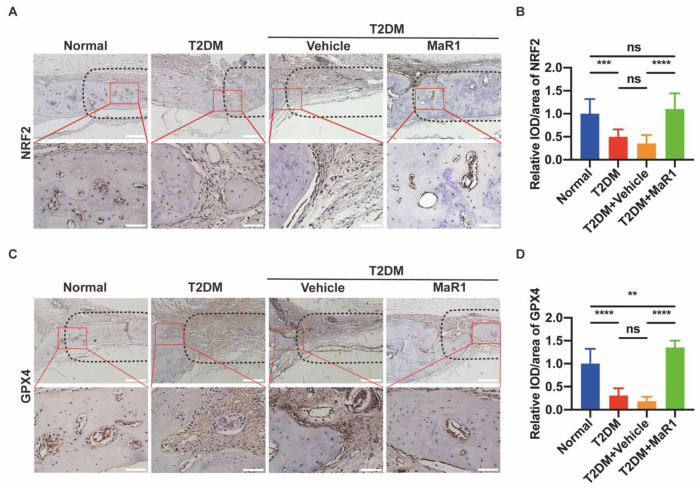
Figure 6.
MaR1 enhances the expression of NRF2 and GPX4. (A) NRF2 protein immunohistochemistry staining. Scale bar = 200 μm and 50 μm. (B) A quantitative examination of NRF2′s mean integral optical density. (C) GPX4 protein immunohistochemistry pictures. Scale bar = 200 μm and 50 μm. (D) Mean integral optical density quantification analysis for GPX4. Data are presented as the means ± SDs for three separate specimens/groups (n = 3). ns p > 0.05; ** p < 0.01; *** p < 0.001; **** p < 0.0001. The black dashed box represents the defect area, and the red solid line box is the magnified visual field. IOD: the mean integrated optical density in the newly formed bone area and the edge of the old bone near the defect. Normal: Normal diet and citrate injection; T2DM: four-week high-carbohydrate, high-fat diet, with STZ intraperitoneal injection (30 mg/kg); T2DM + Vehicle: gelatin sponge was placed in the defect, and the rest were the same as the T2DM group; T2DM + MaR1: gelatin sponge soaked in MaR1 was placed in the defect, and the rest were the same as the T2DM group.

