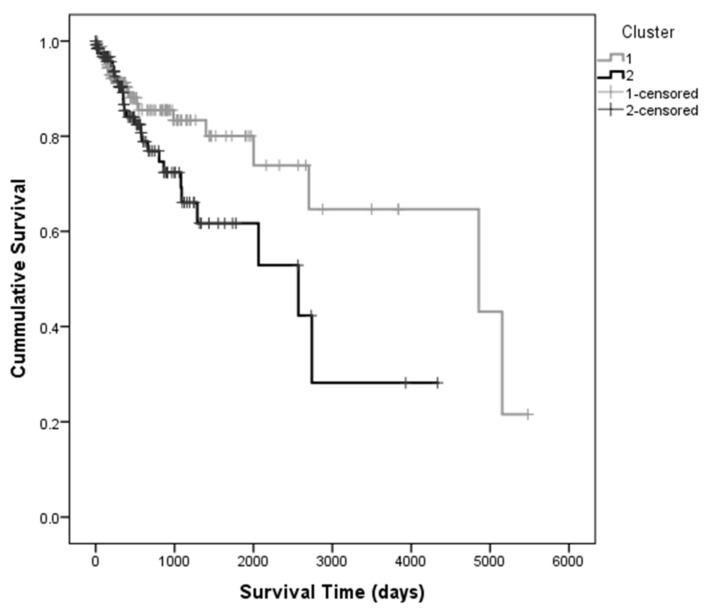
Figure 3.
Kaplan-Meier curves determined for each cluster found using the first ten principal components of the PCA, indicating that patients in Cluster 1 survive, in median, 2 years and 4 months longer than those in Cluster 2 Patients belonging to Cluster 1are represented in grey and Cluster 2 is represented in black.

