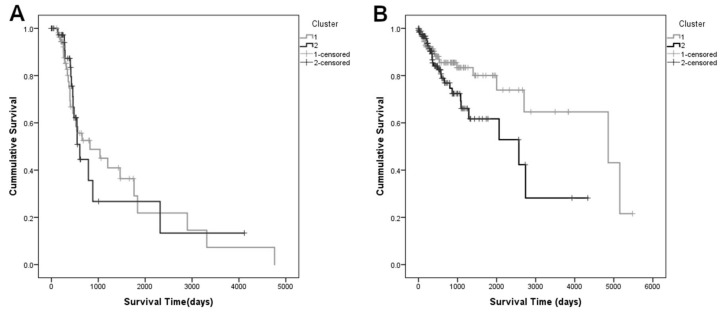
Figure 5.
Kaplan-Meier survival curves for the group that developed metastasis (A) and for the group that did not present metastasis during the time of follow-up (B). Patients belonging to Cluster 1 are represented in grey and Cluster 2 is represented in black. Patients that did not develop metastasis or relapse in Clusters 1 and 2 present well distinguished survival profiles, as opposed to patients that did.

