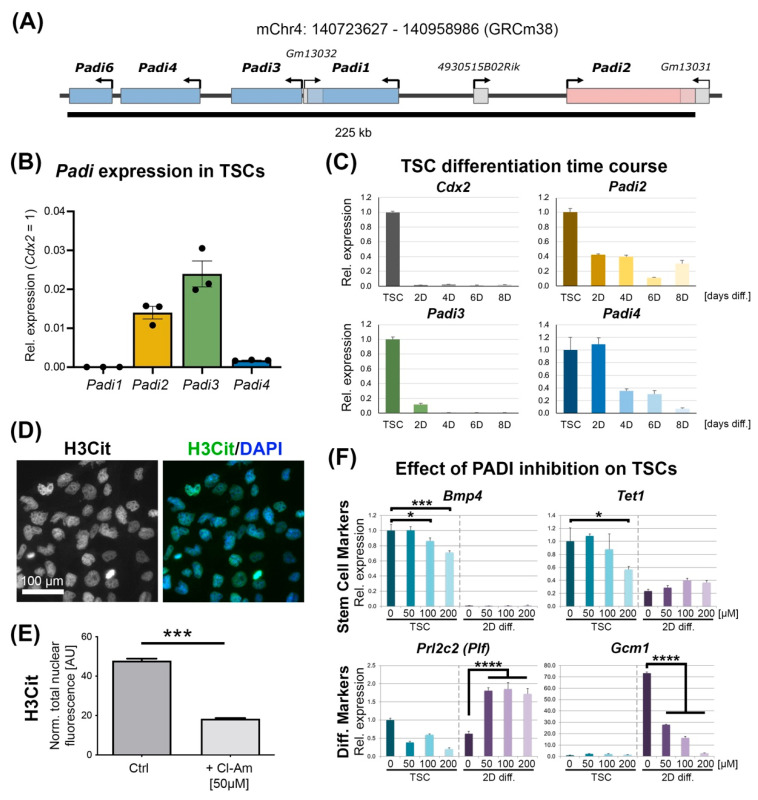
Figure 1.
Padi expression in mouse trophoblast stem cells (TSCs). (A) Schematic representation of the Padi gene locus on mouse chromosome 4. The orientation of each gene is indicated by the arrow, and genes are colour-coded according to the direction with red genes being from left to right, and blue genes from right to left. (B) RT-qPCR analysis of Padi1–Padi4 expression in TSCs. Data are shown relative to expression levels of the well-known TSC marker gene Cdx2, and are displayed as mean +/− S.E.M. (C) RT-qPCR analysis of Padi2, Padi3 and Padi4 expression dynamics during an 8-day (D) TSC differentiation time course. Data are expressed relative to TSC (i.e., stem) conditions and are displayed as mean +/− S.E.M. (n = 3). (D) Immunofluorescence staining against H3-R2/R8/R17 citrullination (H3Cit) in wild-type TSCs. (E) Quantification of H3-R2/R8/R17 citrullination (H3Cit) staining intensities in TSCs and in TSCs after 3 days of exposure to the pan-PADI inhibitor Chlor-Amidine (Cl-Am). Values are normalized to nuclear size. AU = arbitrary units. *** p < 0.001 (unpaired Student’s t-test). (F) RT-qPCR analysis of select stem cell and differentiation markers in TSCs grown under stem cell conditions (“TSCs”) and after 2 days of differentiation (“2D diff.”) in the presence of the indicated amounts of Chlor-Amidine. Data are expressed as relative to stem cell control (0 µM Cl-Am) and are displayed as mean +/− S.E.M. (n = 3 independent replicates). Statistical analysis was conducted for the relevant combinations of markers and conditions (TSC conditions for stem cell markers, 2D diff. conditions for differentiation markers) by 2-way ANOVA with Dunnett’s multiple comparisons test. * p < 0.05, *** p < 0.001, **** p < 0.0001.

