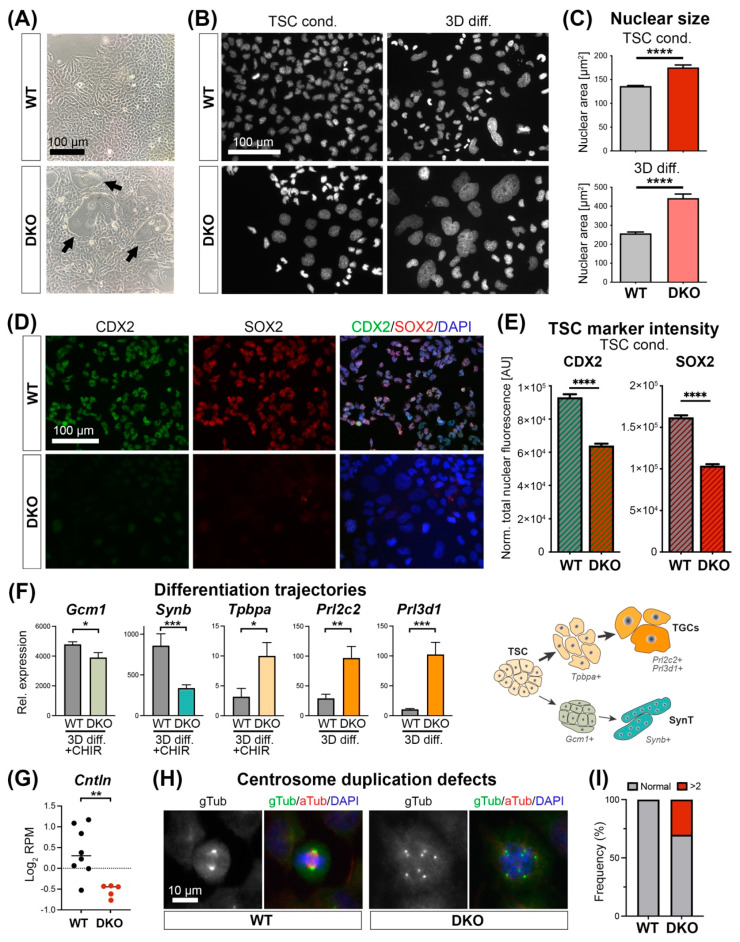
Figure 3.
Padi2/3 DKO TSCs exhibit diminished stem cell potential and are prone to differentiate into large trophoblast giant cells (TGCs). (A) Phase contrast images of wild-type (WT) and Padi2/3 DKO TSCs. Arrows point to extremely large trophoblast giant cell-like cells in the DKO. (B) DAPI-stained nuclei of WT and Padi2/3 DKO TSCs grown under stem cell conditions (TSC cond.) and after 3 days of differentiation (3D diff). Note the extremely large nuclei in the DKO cells even under TSC conditions. (C) Independent and unbiased quantification of nuclear sizes in WT and Padi2/3 DKO cells. Statistical analysis by unpaired Student’s t-test (**** p < 0.0001; n = 4 independent clones per genotype with >150 cells assessed each). (D) Immunofluorescence staining on WT and Padi2/3 DKO TSCs for trophoblast stem cell markers CDX2 and SOX2. (E) Quantification of fluorescence intensities of CDX2 and SOX2 staining. AU = arbitrary units. Statistical analysis by unpaired Student’s t-test (** p < 0.01, **** p < 0.0001; n = 4 independent clones per genotype with >150 cells assessed each). (F) RT-qPCRs for relevant trophoblast differentiation markers on WT and Padi2/3 DKO TSC after 3 days of standard differentiation or 3 days of differentiation in the presence of CHIR99021 (CHIR), which promotes differentiation specifically into syncytiotrophoblast layer-II cells (SynT). The main differentiation trajectories and corresponding marker genes are depicted. Padi2/3 DKO TSCs are prone towards TGC differentiation and significantly inhibited towards SynT differentiation even when pushed towards that lineage with CHIR. Values are displayed relative to TSC (i.e., stem) conditions. Statistical analysis by unpaired Student’s t-test (* p < 0.05; ** p < 0.01, *** p < 0.001; n = 4 independent clones per genotype). (G) Expression levels of Cntln in WT and Padi2/3 DKO TSCs as determined by RNA-seq. Statistical analysis by unpaired Student’s t-test (** p < 0.01). (H) Immunostaining for alpha- and gamma-tubulin demarcating spindle fibres and centrosomes, respectively. (I) Quantification of the number of mitotic cells exhibiting 2 (“Normal”) or more than 2 centrosomes in WT and Padi2/3 DKO TSCs. Data are from 65 WT and 43 Padi2/3 DKO cells that displayed chromosome condensation indicative of (pro)metaphase by DAPI staining.

