Figure 4.
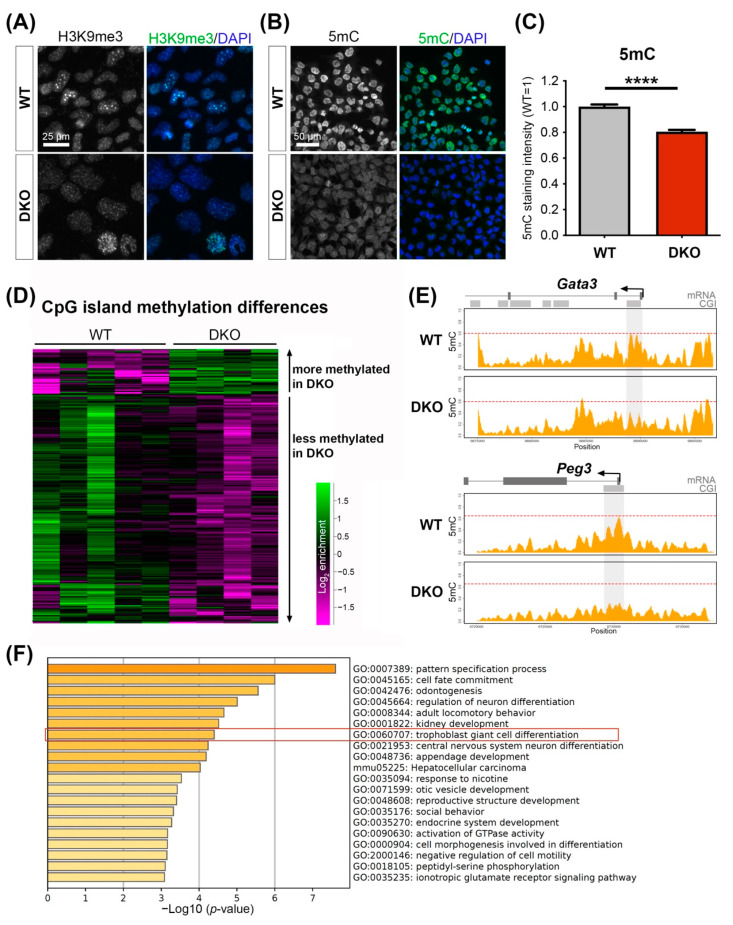
Padi2/3 DKO TSCs exhibit an altered epigenomic landscape. (A) Immunofluorescence staining for H3K9me3 on WT and Padi2/3 DKO TSCs reveals fewer bright heterochromatic foci (chromocentres) and instead, an overall reduced and more finely dispersed staining pattern of this heterochromatic mark in Padi2/3 DKO cells. (B) 5-methylcytosine (5mC) immunostaining on WT and Padi2/3 DKO TSCs. (C) Quantification of 5mC fluorescence intensities shows reduced amounts of 5mC in DKO cells. Statistical analysis by unpaired Student’s t-test (**** p < 0.0001; n = 4 independent clones per genotype with >150 cells assessed each). (D) Heatmap of read count enrichment across developmentally regulated CpG islands (CGIs) [32] as determined by meDIP-seq profiling. (E) Wiggle plots of 5mC enrichment across the Gata3 and Peg3 loci. Gene structure (exons) and CGIs are displayed on top of the graphs. The differentially methylated CGIs are shaded. The red dotted line demarcates the level of maximal enrichment in WT cells, and is drawn at corresponding levels in the DKO graph to help visualize the reduction in 5mC enrichment. (F) Metascape gene ontology analysis showing significantly enriched terms for genes associated with hypomethylated CGIs in Padi2/3 DKO TSCs.

