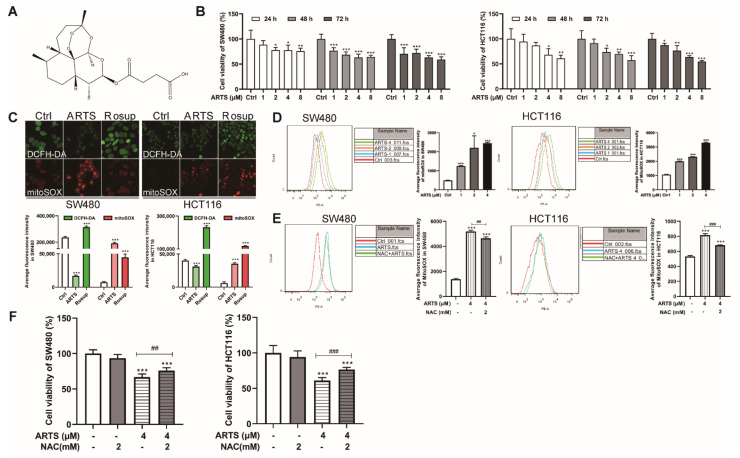
Figure 1.
Artesunate inhibited cell viabilities partially due to excessive mitochondrial ROS. (A) The endoperoxide structure of artesunate. (B) Artesunate inhibited cell viabilities of SW480 and HCT116 dose-dependently. The colorectal cancer cell lines, SW480 and HCT116, were seeded in 96-well plates and treated with artesunate at 1, 2, 4, and 8 μM for 24, 48, 72 h. Cell viabilities were detected via CCK8 assay. (C) Artesunate caused mitochondrial ROS generation. Cells were seeded in glass-bottomed dishes and treated with artesunate (4 μM) for 72 h. DCFH-DA (Green) and MitoSOXTM Red (Red) was used to label the total intracellular ROS and mitochondrial specific ROS respectively. Images were captured by confocal microscope (Scale bar = 25 μm). Rosup was used as a positive agent of ROS inducer. (D) Mitochondrial ROS was increased dose-dependently. Cells were probed with MitoSOXTM Red after artesunate treatment. The fluorescence intensity of MitoSOXTM Red was record by flow cytometry to indicate the mitochondrial ROS level. The ROS scavenger NAC helped to (E) decrease the mitochondrial ROS, and (F) restore cell viabilities in treated SW480 and HCT116. NAC was used at a concentration of 2 mM and added alone or together with artesunate (4 μM) for 72 h before cell viability assay and MitoSOXTM Red incubation. * p < 0.05, ** p < 0.01, and *** p < 0.001 vs. Ctrl. ## p < 0.01, and ### p < 0.001 vs. cells treated with artesunate alone. Data were shown as mean ± SD.

