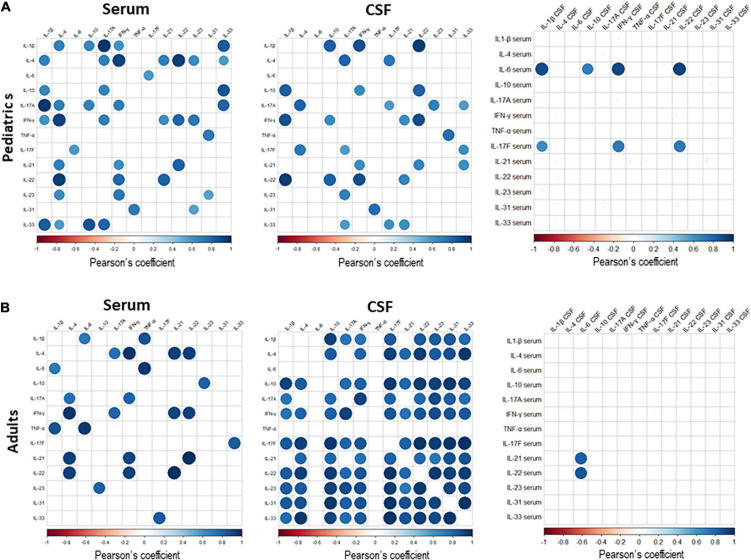
FIGURE 7.
The correlation matrix among all cytokines expressed in serum and cerebrospinal fluid (CSF) of pediatric (A) and adult (B) Spinal muscular atrophy (SMA) patients. Pearson’s correlation coefficients r ≥0.5 or ≤0.5 are shown. White squares lack statistical significance (p > 0.05). The color in each circle indicates the Pearson’s correlation coefficient r among the variables reported in the two coordinates, as indicated by colored scale bar.

