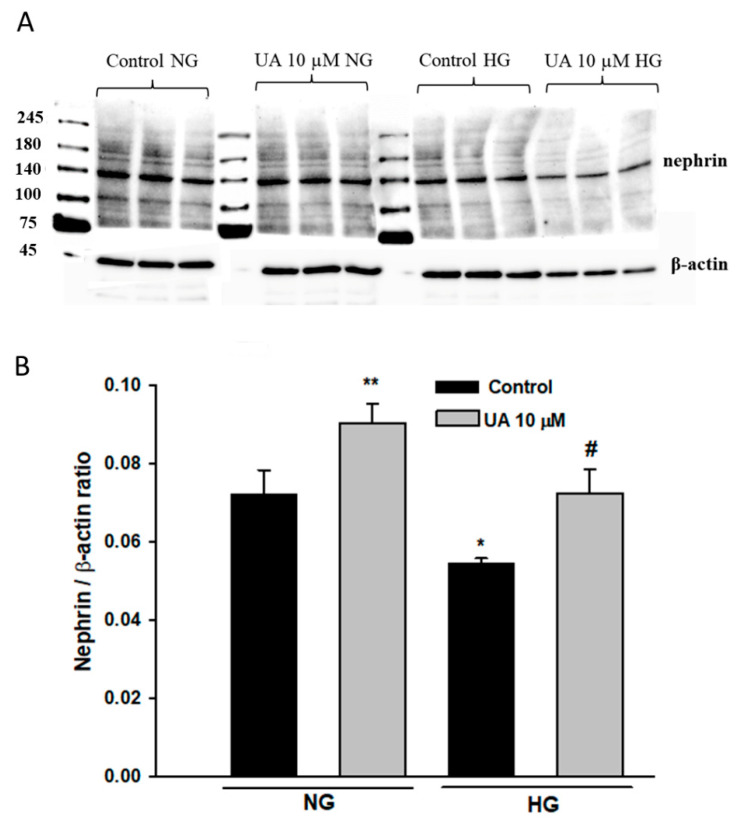
Figure 11.
Urolithin A increased total nephrin expression in podocytes. 30-µg protein samples from total cell lysates were subjected to Western blot analysis followed by quantitative densitometric analysis. Nephrin expression in mouse kidney cortex homogenate served as a positive control. A representative immunoblot (A). Experiments were performed in triplicate. Results of quantitative densitometric analysis corrected for β-actin show mean ± SEM (B). The Student’s t-test was used to calculate p values. * p < 0.05, ** p < 0.01 vs. Control NG, # p < 0.05 vs. Control HG (n = 3–5).

