Figure 2.
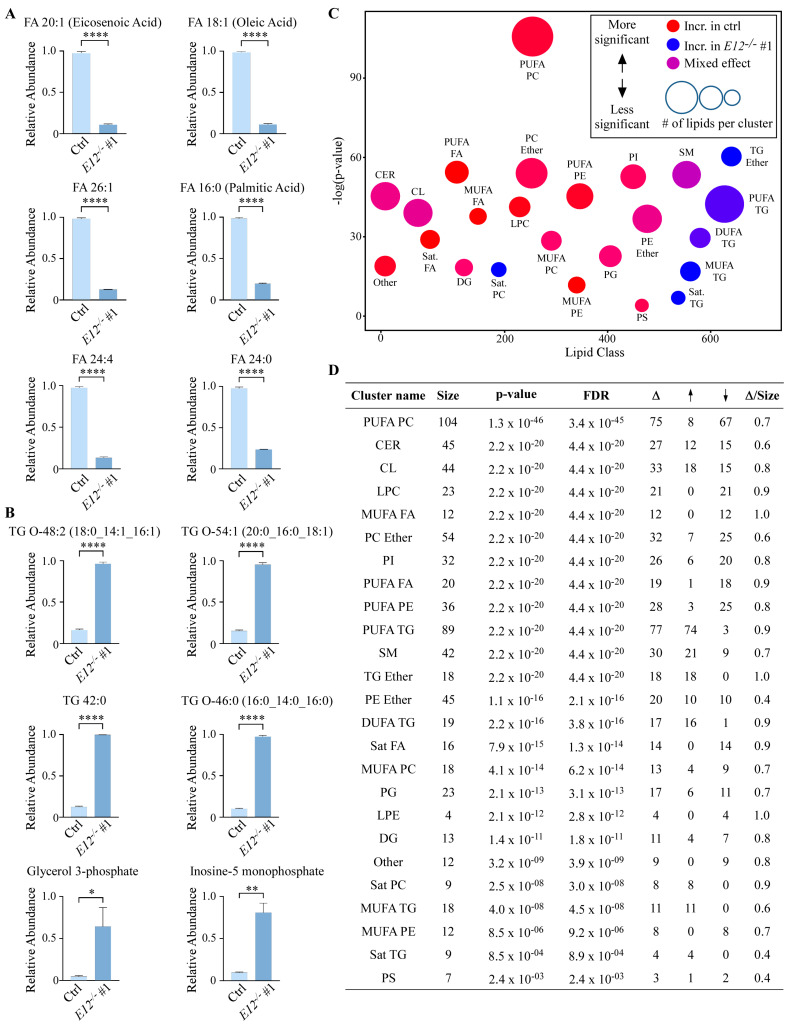
Loss of E12 leads to lipidome changes in H1299 cells. A-B. (A) Top six downregulated and (B) upregulated metabolites in E12−/− compared to isogenic control H1299 cells. TG-O indicates triacylglycerols with an ether bond. Statistical significance was determined using Student’s t-test. Data are presented as mean ± SEM. n = 3 independent experiments. * p < 0.05, ** p < 0.01, **** p < 0.0001. (C). ChemRICH of all lipids identified in isogenic control and E12−/− H1299 cells. Y-axis represents statistical significance assessed by Kolmogorov-Smirnov test and node size represents total number of lipids per cluster. MUFA: mono-unsaturated fatty acids; DUFA: di-unsaturated fatty acids; PUFA: poly-unsaturated fatty acids; Sat: saturated. (D). Lipid clusters with significant alterations due to loss of E12 determined by ChemRICH analysis. Δ indicates number of lipids altered in a cluster; ↑ indicates number of increased lipids in E12−/− compared to isogenic control H1299 cells; ↓ indicates number of decreased lipids in E12−/− compared to isogenic control H1299 cells; FDR indicates false discovery rate; Δ/size shows the proportion of significantly altered lipids within each class.

