Figure 3.
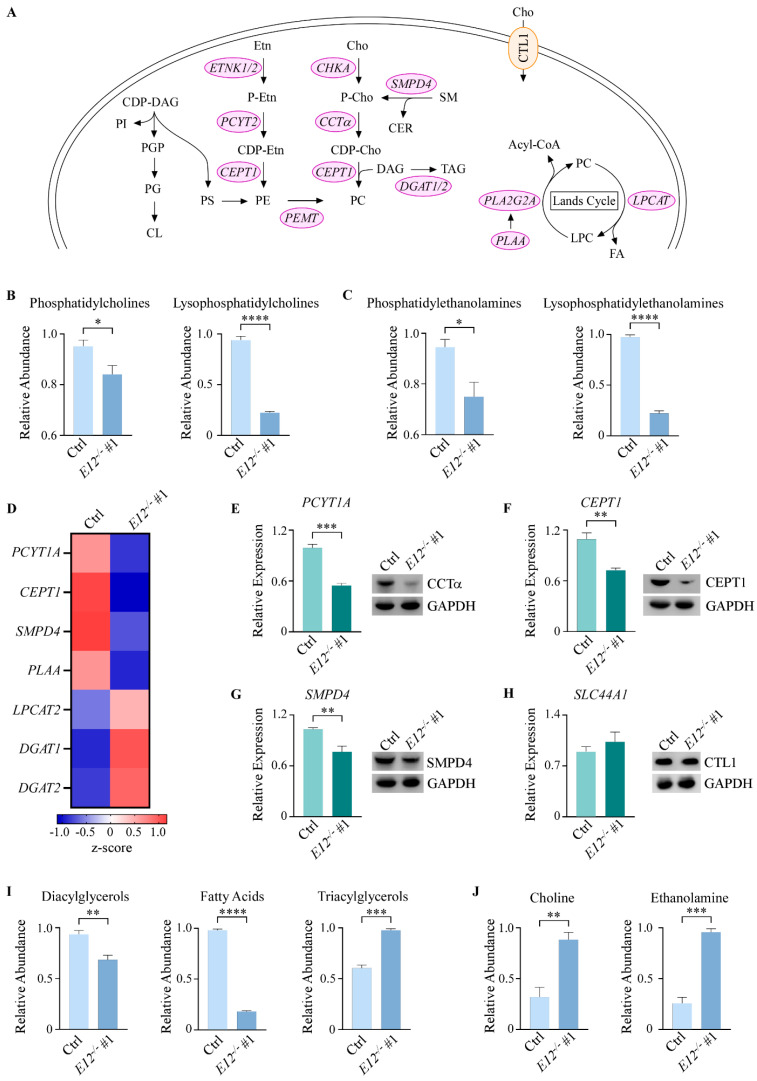
Kennedy pathway metabolites are altered upon knockout of E12 in H1299 cells. (A). Schematic overview of the Kennedy pathway. CDP-DAG: CDP-diacylglycerol; PI: phosphatidylinositol; PG: phosphatidylglycerol; CL: cardiolipin; PS: phosphatidylserine; Cho: choline; P-cho: phosphocholine, CDP-cho: cytidine diphosphate-choline; Etn: ethanolamine, P-Etn: phosphoethanolamine; CDP-Etn: cytidine diphosphate-ethanolamine; SM: sphingomyelin; CER: ceramide; DAG: diacylglycerol; TAG: triacylglycerol; FA: fatty acid; CTL1: choline transporter-like protein 1. (B,C). Relative abundance of (B) phosphatidylcholines and lysophosphatidylcholines and (C) phosphatidylethanolamines and lysophosphatidylethanolamines in isogenic control and E12−/− H1299 cells. Statistical significance was determined using Student’s t-test. (D). Heat map of differentially expressed genes identified by RNA-seq analysis in isogenic control and E12−/− H1299 cell lines. Color density indicating z-score values was displayed below. (E–H). (Left) qPCR was used to quantify relative mRNA levels of PCYT1A, CEPT1, SMPD4, and SLC44A1 in isogenic control and E12−/− H1299 cell lines. All values were normalized to HPRT1 and are presented as relative to isogenic control (light green). Statistical significance was determined using Student’s t-test. (Right) Western blot analysis was used to determine CCTa, CEPT1, SMPD4, CTL1, and GAPDH protein levels in isogenic control and E12−/− H1299 cell lines. (I,J). Relative abundance of (I) diacylglycerols, fatty acids, and triacylglycerols, and (E) choline and ethanolamine in isogenic control and E12−/− H1299 cells. Statistical significance was determined using Student’s t-test. For B-C and E-J. Data presented as mean ± SEM. n = 3 independent experiments. * p < 0.05, ** p < 0.01, *** p < 0.001, **** p < 0.0001.

