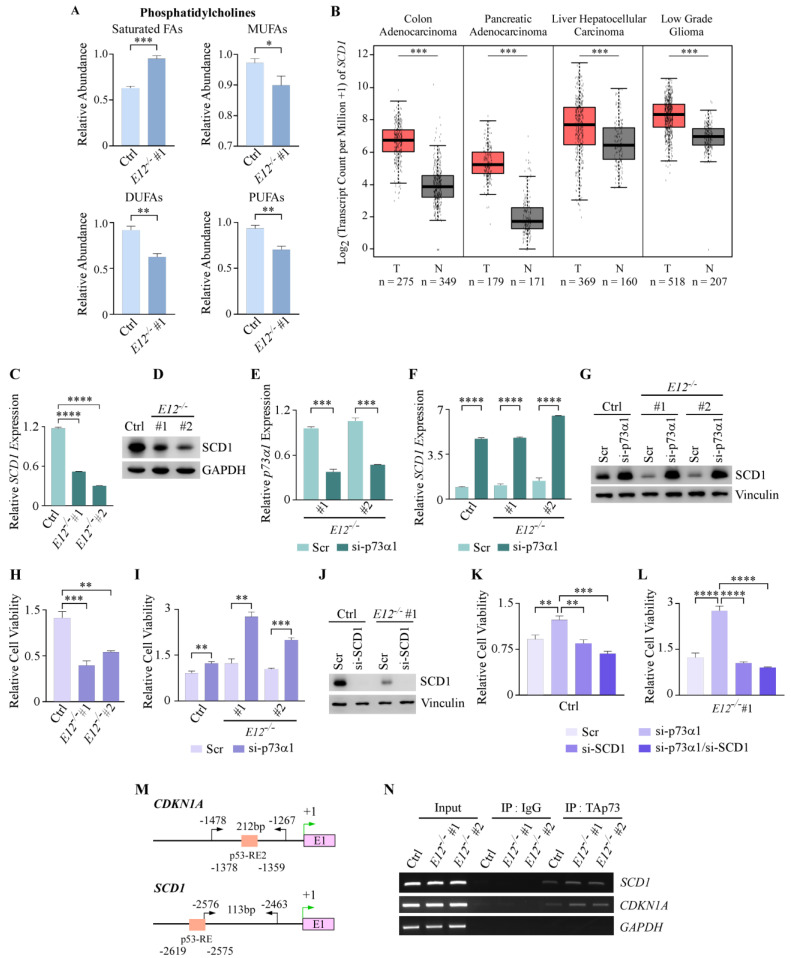
Figure 4.
p73α1 suppresses cell viability by directly inhibiting SCD1 expression. (A). Relative abundance of PC saturation level in isogenic control and E12−/− H1299 cells. Statistical significance was determined using Student’s t-test. (B). SCD1 transcript counts in the indicated tumors (data from TCGA) and the matched normal tissues (data from TCGA and GTEx) were analyzed via Gene Expression Profiling Interactive Analysis (GEPIA; http://gepia.cancer-pku.cn/index.html; accessed on 6 May 2022). T: tumor; N: matched normal tissue. (C). qPCR was used to quantify relative mRNA levels of SCD1 in isogenic control and E12−/− H1299 cell lines. All values were normalized to HPRT1 and are presented as relative to isogenic control (light green). Statistical significance was determined using one-way ANOVA. (D). Western blot analysis was used to determine SCD1 and GAPDH protein levels in isogenic control and E12−/− H1299 cell lines. (E). qPCR was used to quantify relative mRNA levels of p73α1 in E12−/− H1299 cells treated with scramble siRNA (Scr) or si-p73α1 for 48 h. All values were normalized to HPRT1 and are presented as relative to each Scr-treated cell line. Statistical significance was determined using multiple Student’s t-tests comparing Scr to si-p73α1 treatment for each cell line. (F). Cells were treated as in (C) and qPCR was used to quantify relative mRNA levels of SCD1. All values were normalized to HPRT1 and are presented as relative to each Scr-treated cell line. Statistical significance was determined using multiple Student’s t-tests comparing Scr to si-p73α1 treatment for each cell line. (G). Cells were treated as in (C) and Western blot analysis was used to determine SCD1 and Vinculin protein levels. (H). Cells were treated as in (C) and cell viability of the Scr-treated cell lines was determined using CellTiter-GLO. Cell viability for E12−/− #1 and #2 (dark purple) were presented as relative to isogenic control cells (light purple). Statistical significance was determined using one-way ANOVA. (I). Cells were treated as in (C) and cell viability was determined using CellTiter-GLO. Cell viability for isogenic control cells treated with si-p73α1 was presented as relative to isogenic control Scr-treated cells. Cell viability for E12−/− #1 cells treated with si-p73α1 was presented as relative to E12−/− #1 Scr-treated cells. Cell viability for E12−/− #2 cells treated with si-p73α1 was presented as relative to E12−/− #2 Scr-treated cells. Statistical significance was determined using multiple Student’s t-tests comparing Scr to si-p73α1 treatment for each cell line. (J). Western blot analysis of SCD1 and Vinculin proteins in isogenic control and E12−/− H1299 cell lines treated with Scr or si-SCD1 for 48 h. (K). Cell viability was determined using CellTiter-GLO in the isogenic control H1299 cell line treated with Scr, si-p73α1, si-SCD1, or si-p73α1 and si-SCD1 for 48 h. Cell viability for isogenic control cells treated with si-p73α1, si-SCD1, or si-p73α1 and si-SCD1 was presented as relative to isogenic control Scr-treated cells. Statistical significance was determined using one-way ANOVA. (L). Cell viability was determined using CellTiter-GLO in the E12−/− H1299 cell line treated with Scr, si-p73α1, si-SCD1, or si-p73α1 and si-SCD1 for 48 h. Cell viability for E12−/− cells treated with si-p73α1, si-SCD1, or si-p73α1 and si-SCD1 was presented as relative to E12−/− Scr-treated cells. Statistical significance was determined using one-way ANOVA. (M). Diagram of the putative p53-Response Elements (p53-RE) (orange) in the promoter of CDKN1A and SCD1. Locations of the primers used to amplify the p53-RE in the promoters of CDKN1A and SCD1 are indicated by the black arrows. Green arrows indicate transcription start site; E1 indicates exon 1. (N). ChIP analysis was performed with isogenic control and E12−/− H1299 cells. Cell lysates were immunoprecipitated with anti-rabbit IgG or anti-TAp73 to bring down the DNA-protein complex. DNA fragments were visualized by PCR with primers for SCD1, CDKN1A, and GAPDH promoters. For (A,C,E,F,H,I,K,L). Data are presented as mean ± SEM. n = 3 independent experiments. * p < 0.05, ** p < 0.01, *** p < 0.001, **** p < 0.0001.

