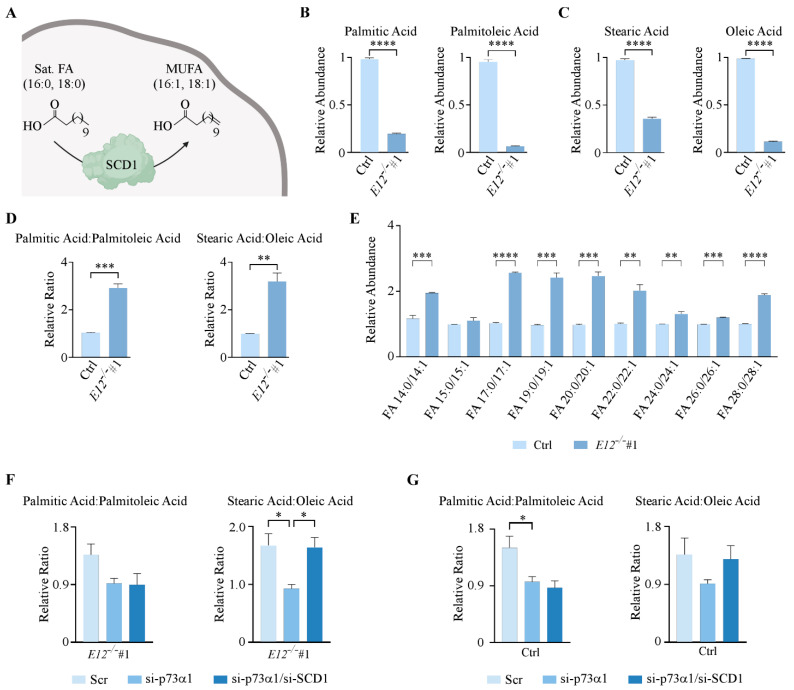
Figure 5.
p73α1-mediated suppression of SCD1 leads to an increased ratio of saturated FAs to MUFAs. (A). Schematic representation of SCD1 enzymatic activity. (B,C). Relative abundance of (B) palmitic acid and palmitoleic acid and (C) stearic acid and oleic acid in isogenic control and E12−/− H1299 cells. Statistical significance was determined using Student’s t-test. (D). Ratio of (left) palmitic acid to palmitoleic acid and (right) stearic acid to oleic acid in isogenic control and E12−/− H1299 cells. Statistical significance was determined using Student’s t-test. (E). Ratio of saturated FAs to MUFAs for the indicated FA chain length in isogenic control (light blue) and E12−/− (dark blue) H1299 cells. Statistical significance was determined using multiple Student’s t-tests comparing isogenic control and E12−/− cell lines for each saturated/unsaturated FA pair. (F). Ratio of (left) palmitic acid to palmitoleic acid and (right) stearic acid to oleic acid in E12−/− H1299 cells following treatment with Scr, si-SCD1, or si-SCD1 and si-p73α1 for 48 h. Statistical significance was determined using one-way ANOVA. (G). Ratio of (left) palmitic acid to palmitoleic acid and (right) stearic acid to oleic acid in isogenic control H1299 cells treated with Scr, sip73α1, or sip73α1 and siSCD1 for 48 h. Statistical significance was determined using one-way ANOVA. For B-G. Data are presented as mean ± SEM. n = 3 independent experiments. * p < 0.05, ** p < 0.01, *** p < 0.001, **** p < 0.0001.

