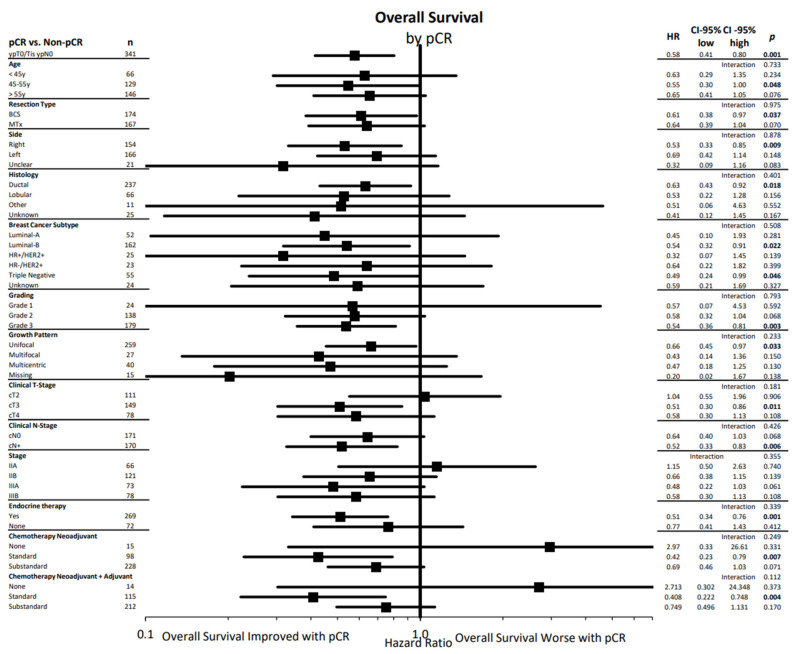
Figure 2.
Cox regression analysis of overall survival by pCR-status (yes vs. no) status in different subgroups with hazard ratios, their corresponding confidence intervals and fitting interaction tests presented in a forest plot. pCR: pathologic complete response, BCS: breast-conserving surgery, MTx: mastectomy, HR+: hormone receptor positive, HER2: human epithelial growth factor receptor 2, c: clinical, T: tumor, N: nodal, G: grading, HR: hazard ratio, CI: confidence interval. Statistically significant differences are marked in bold.

