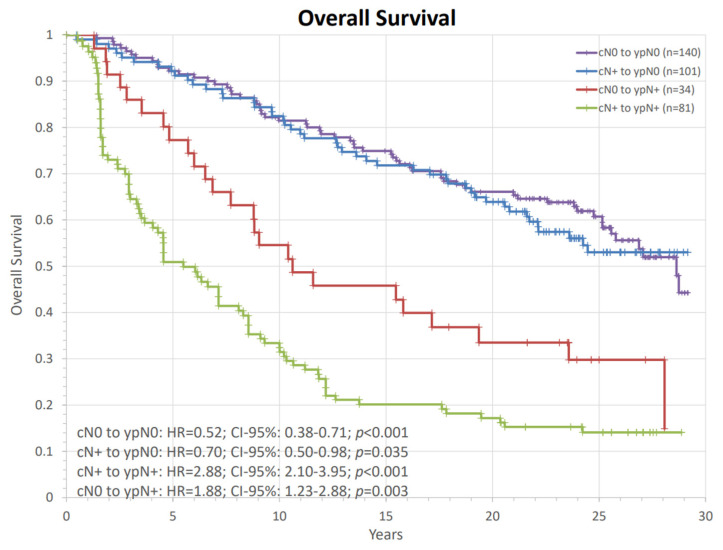
Figure 6.
Analysis of the impact of clinical and pathological nodal status on overall survival. The comparisons of each group are set against the remaining patients in the whole cohort and are presented with hazard ratios and their corresponding confidence intervals and p-values. HR: hazard ratio, ypT: postoperative primary tumor stage, ypN: postoperative nodal stage, CI: confidence interval, pCR: pathological complete response, n: number of patients.

