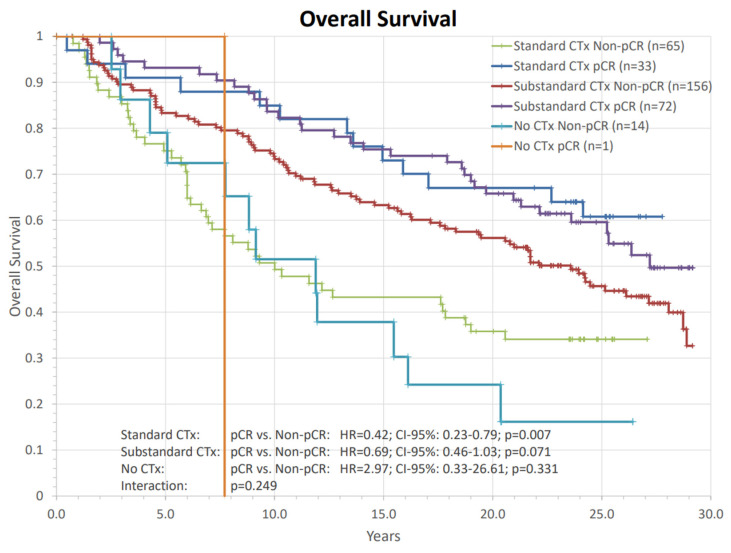
Figure 7.
Analysis of the impact of pathological complete response (pCR) on overall survival between different preoperative chemotherapy regimens. The comparisons are presented with hazard ratios and their corresponding confidence intervals and p-values. HR: hazard ratio, CTx: chemotherapy, CI: confidence interval, pCR: pathological complete response, n: number of patients.

