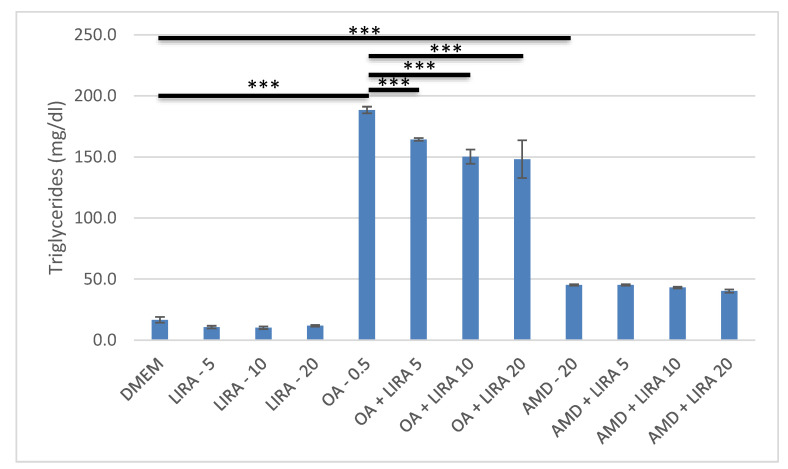
Figure 4.
Triglyceride content in DIS and NAS cell culture models, incubated with varying concentrations of LIRA. One-way ANOVA F (11, 35) = 579.2; p = 2.62 × 10⁻²⁶ post-hoc Tukey HSD. Bars assigned with asterisks are statistically significantly different (*** p < 0.001). The data are shown as the means ± SD (standard deviation) from at least three biological replicates. Dulbecco’s modified Eagle’s medium (DMEM), LIRA (LIRA/nM), oleic acid (OA/mM), amiodarone (AMD/µM).

