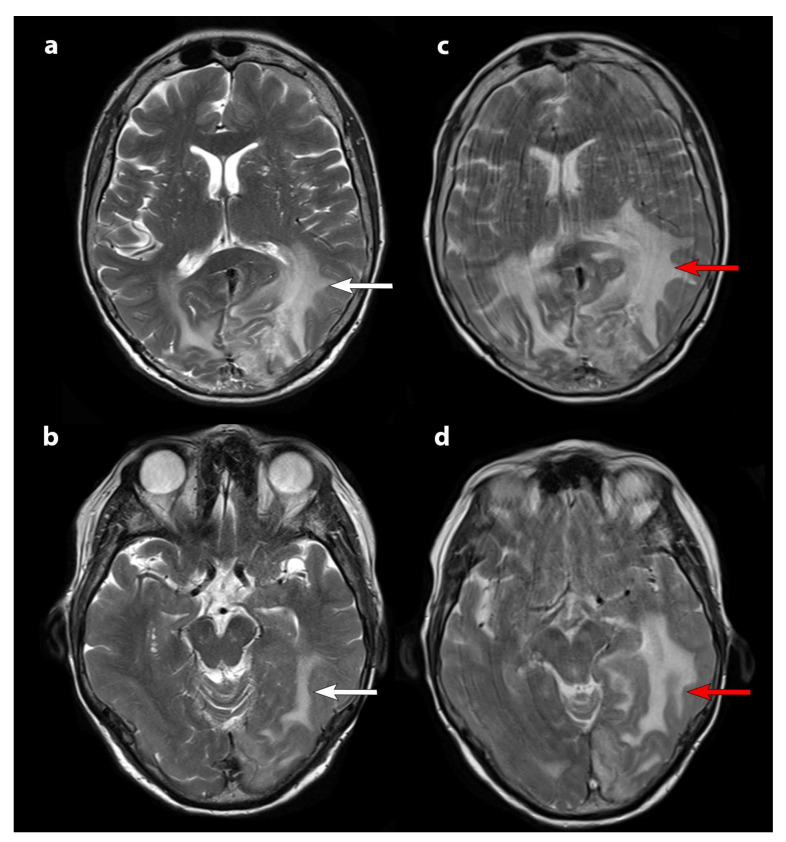
Figure 3.
T2-weighted axial slice MRI. MRI before therapy (panels (a) and (b)) and after the second cycle of PRRT (panels (c) and (d)). White arrows show brain edema on baseline MRI which increases after the second cycle (red arrows). An increase in kinetic movements at the time of the second MRI (panels (c) and (d)) were due to the patient’s clinical deterioration in parallel with the radiological progression.

