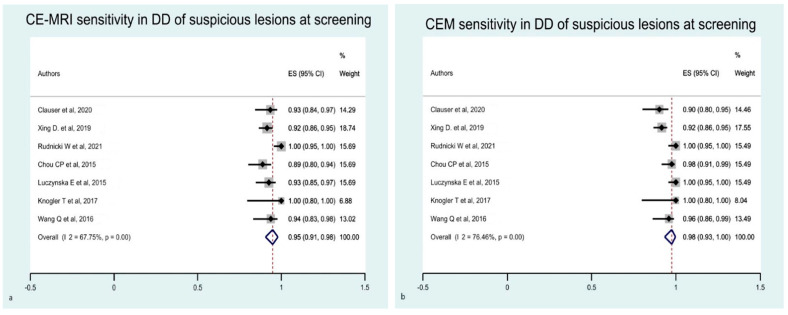
Figure 6.
Forest plot of the estimated pooled sensitivity of breast CE-MRI (a) and CME (b) for the differential diagnosis of suspicious lesions at screening. The estimated pooled sensitivity of CE-MRI (a) was 0.95 (95% CI 0.91–0.98), with a moderate heterogeneity (I2 = 67.75% p = 0.001). The estimated pooled sensitivity of CME (b) was 0.98 (95% CI 0.93–1.00), with a high heterogeneity (I2 = 76.46% p = 0.001) [16,17,18,21,28,29,30].

