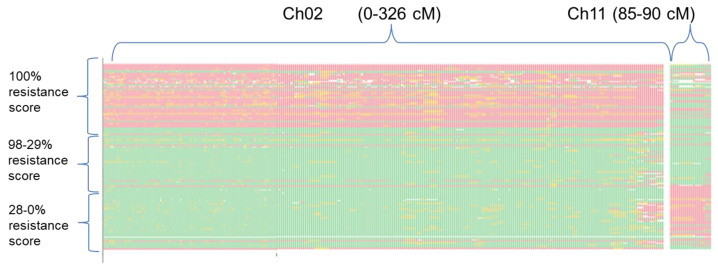
Figure 4.
Haplotype distribution in the RIL population of all GBS markers mapped on CH02 (0–326 cM) and CH11 (85–90 cM) was ordered according to their resistance scores (on the left panel, descending from 100% to 0). Each line represents RIL progeny. In red, haplotype of ‘305E40’; in green haplotype of ‘67/3’; in yellow heterozygous markers; in white, missing data.

