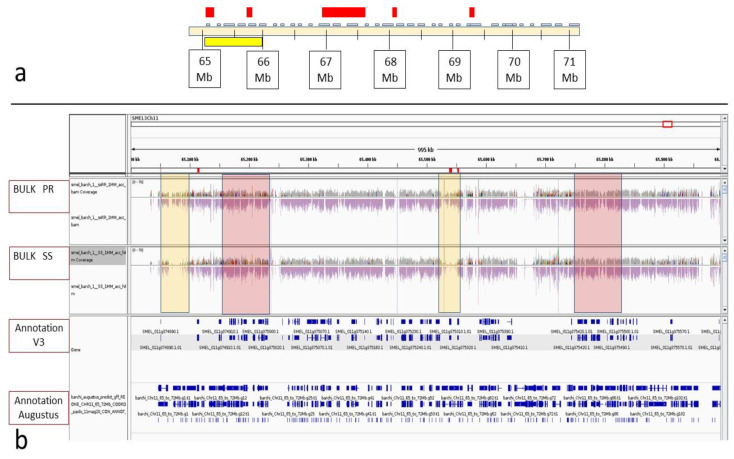
Figure 5.
Example of IGV visual score in the region spanning 65 and 66 MB on chromosome 11. (a) In the upper panel, the region ranging from 63–71 Mb comprising within the CI of the FomCH11 QTL is represented. The yellow box depicts the region zoomed in the box below. The red boxes indicate the position of the 5 differentially enriched regions highlighted from BSA-seq analyses. (b) Read alignments of the two bulks PR (on the top) and SS (bottom) against the reference sequence of ‘67/3’ are shown, together with the annotated genes according to V3 genome sequence ([35], top) and the additional Augustus annotation (bottom), also including TE-related genes. The two yellow rectangles highlight two differentially enriched regions between bulks of PR and SS (i.e., with different read coverages detectable when comparing upper and lower panels), while the pink rectangles highlight the position of two non-enriched ones.

