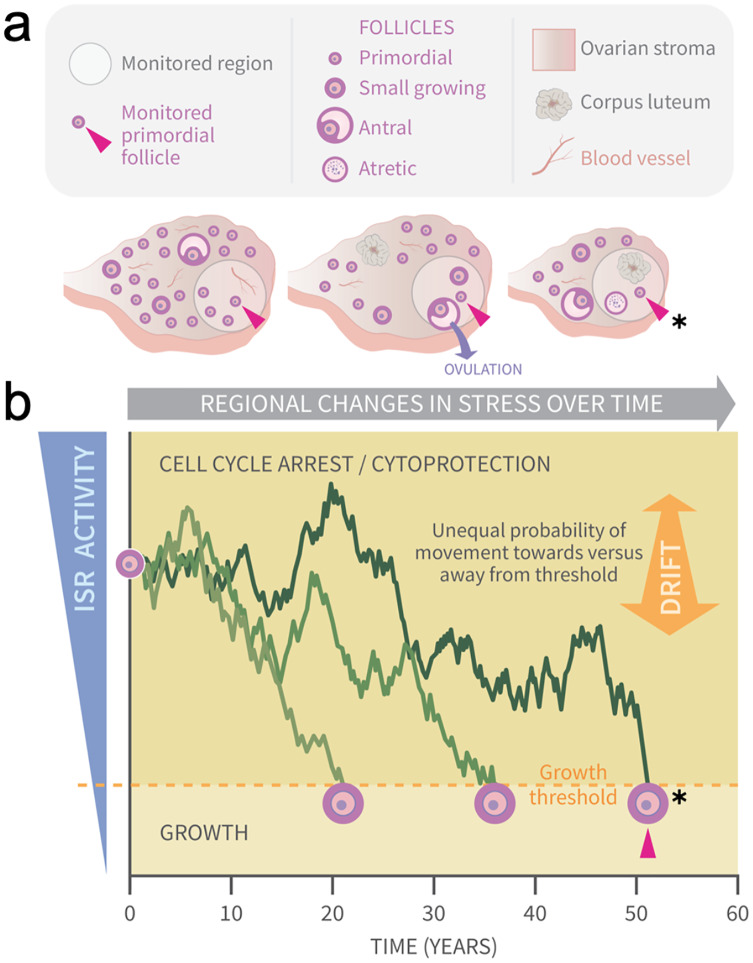
Figure 1. Graphical abstract: modeling primordial ovarian follicle growth activation with random walks.
The control mechanism that determines when individual primordial follicles (PFs) begin to grow over time is unknown. The ovary is a uniquely dynamic organ that undergoes constant remodeling (ovaries, A) as follicles grow and die, and sometimes ovulate and form corpora lutea. The organ also changes with age, and this includes diminishing numbers of follicles, alterations in the ovarian stroma, and changes in blood vessels and their distribution. These dynamic changes include regional signaling differences in the ovary (intra-ovarian “microenvironments”), including factors that induce stress and damage over time (grey arrow). In (A), the same dormant PF (red arrowhead) and its immediately surrounding ovarian region are monitored over time. As structures develop, change, and die in that region, the monitored PF is subject to dynamically changing signals and physiological damage-inducing agents that activate the ISR. Spatiotemporally fluctuating ISR activity is simplified in (B) (modified from Llerena Cari et al. (2021)). When ISR activity is high, CELL CYCLE ARREST and CYTOPROTECTION occur due to checkpoint activation. If ISR activity declines enough in a PF to the point of ISR checkpoint resolution, a Growth Threshold is crossed, and pregranulosa cell cycle entry and GROWTH occurs (asterisk, monitored PF). In (B), three PFs experience fluctuating ISR activity due to fluctuating stress and damage (y-axis) over time (x-axis), and this is modeled as random walks (RWs). Each PF begins the RW at time 0 (“birth”, PF on y-axis), and dark plot lines indicate changing ISR activity as a RW over time (x-axis). Two PFs cross the PFGA threshold at approximately ages 21 and 38, and the monitored PF in (A) crosses the threshold at age 52 (red triangle, asterisk). Impacts of the following potential sources of variability between simulated women upon RW patterns and the timing of PF exhaustion are considered. First, variation in PF numbers between subjects around the time of birth is modeled according to the reported distribution (starting supply, Wallace & Kelsey (2010)). Second, the probability of PF movement is modified so that “drift” towards the growth threshold occurs (B, orange block arrow at right); the amount of drift is optionally modeled to vary between simulated subjects.

