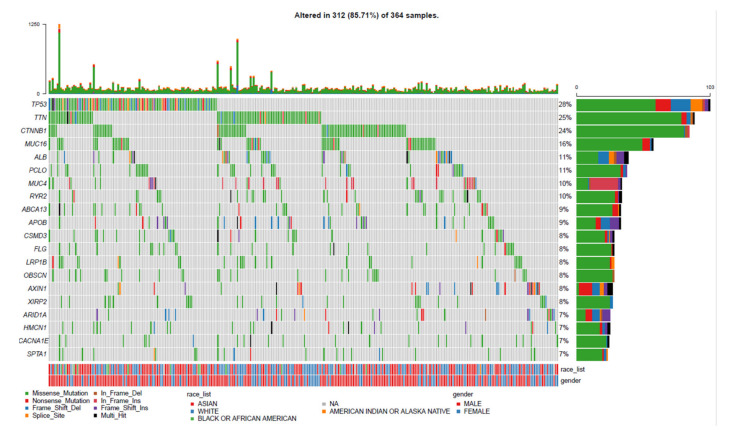
Figure 1.
Landscape profile of top 20 mutated genes in 364 LIHC from TCGA database. Mutations of each gene in each sample are shown in waterfall plot. Each column presents specific sample, each line presents mutated gene, and name is listed on left. Different forms of somatic mutations and percentages of gene mutation types are shown on right (color version of figure is available online). LIHC: Liver Cancer; TCGA: The Cancer Genome Atlas.

