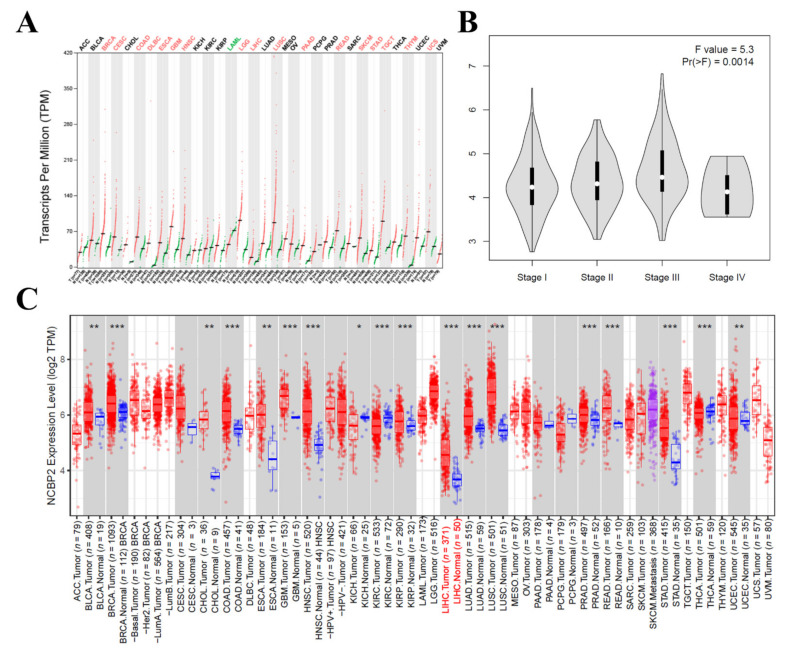
Figure 5.
NCBP2 expression levels in HCC. (A) Expression patterns of NCBP2 in 33 cancer types and paired non-tumor samples. (B) Violin plots reveal relationship between NCBP2 expression and LIHC staging. (C) Human NCBP2 expression levels in different tumor types determined by TIMER (* p < 0.05, ** p < 0.01, *** p < 0.001). TIMER: Tumor Immune Estimation Resource.

