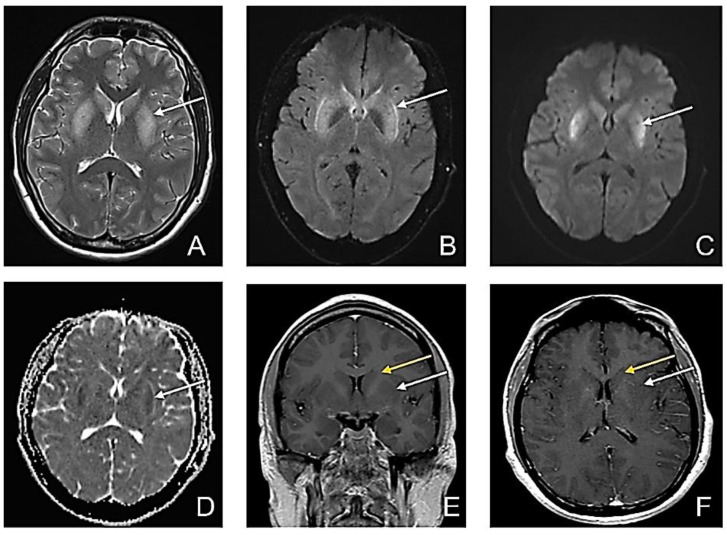
Figure 2.
Second MRI-D5. (A) Axial T2-weighted image sequence: bilateral putaminal high signal intensity; (B) Axial FLAIR sequence: bilateral putaminal high signal intensity; (C) Axial DWI: high signal intensity in putaminal regions; (D) Axial ADC map: low ADC in the putaminal regions suggestive of restricted diffusion in both putaminal regions (white arrow); (E) Contrast-enhanced Coronal T1wi; and (F) Contrast-enhanced Axial T1wi: no enhancement in the bilateral caudate nucleus (yellow arrow) and putamen (white arrow) with slightly decreased signal in bilateral putamen.

