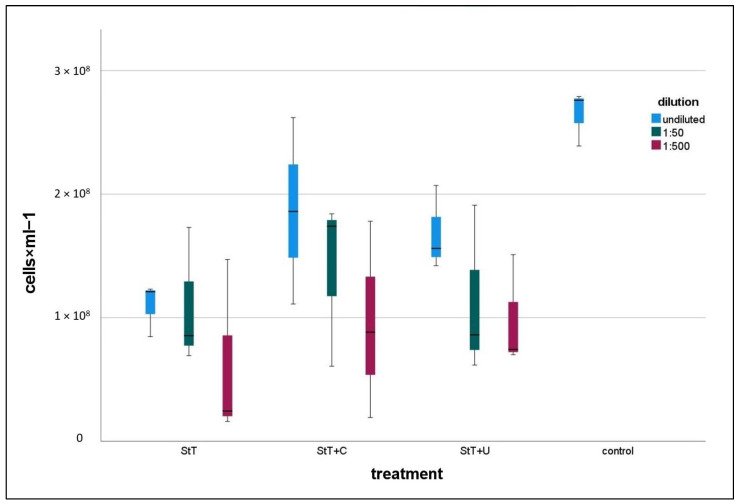
Figure 3.
Box plot presenting FCM cell counts of treated and untreated (control) cultures. Treated groups include cell counts of undiluted, 1:50 diluted and 1:500 diluted cultures. StT = Standard Treatment; StT+C = Standard Treatment + Chloramphenicol; StT+U = Standard Treatment + Ultrasonication. n for each group = 3.

