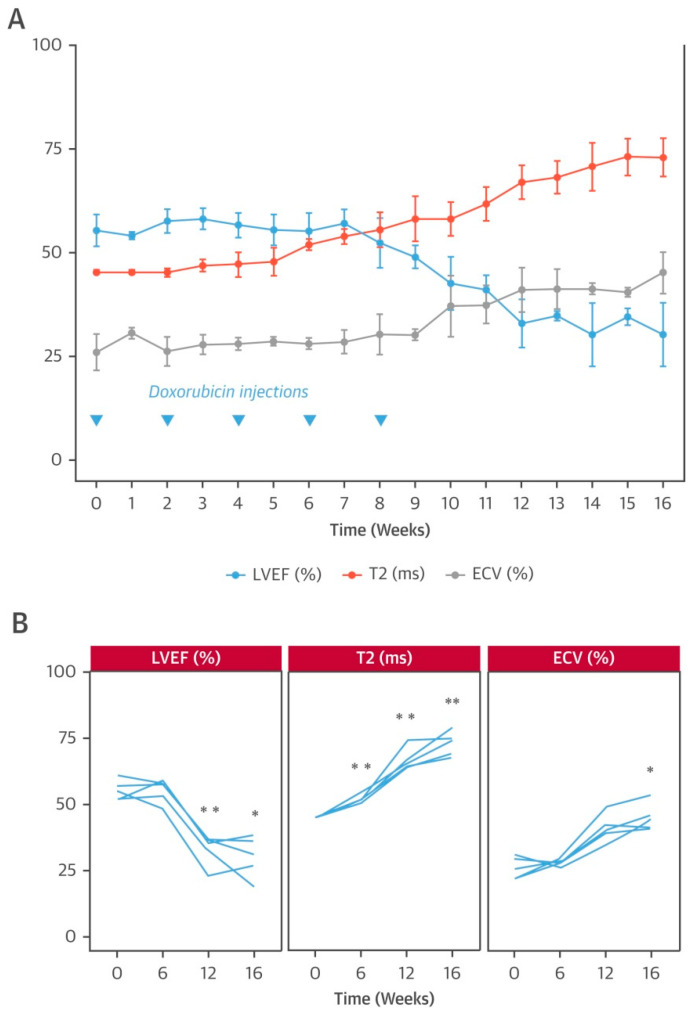
Figure 3.
Animal model of anthracycline cardiotoxicity. (A) Time course of CMR imaging studies in pig model that received 5 biweekly doxorubicin injections and follow-up to week 16. Data are represented as mean ± SD (bars); (B) Individual animal data at selected time points for LVEF, T2, and ECV. Asterisks indicate statistically significant differences compared with week 0: * p < 0.05, ** p < 0.01. Reprinted with permission from Ref. [40]. 2019, Elsevier.

