Figure 3.
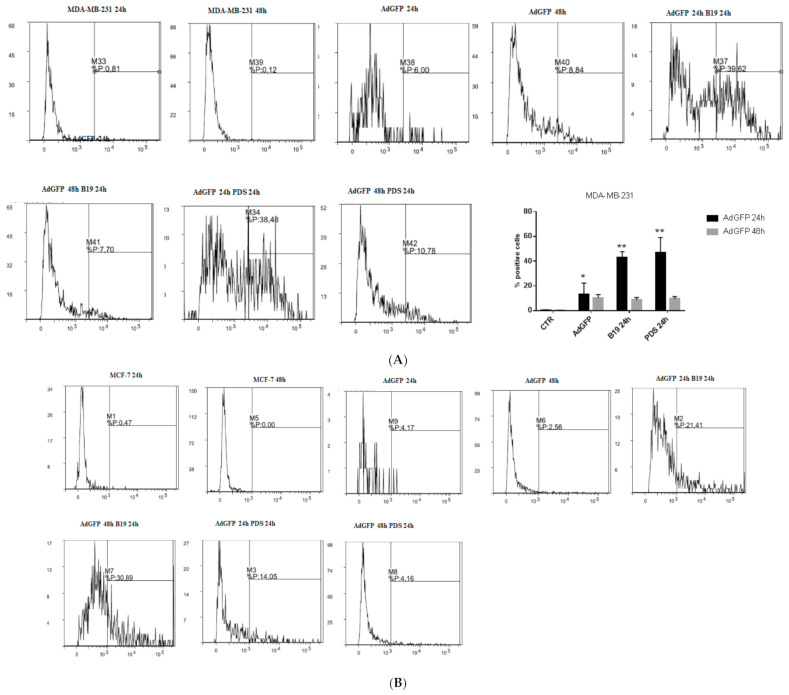
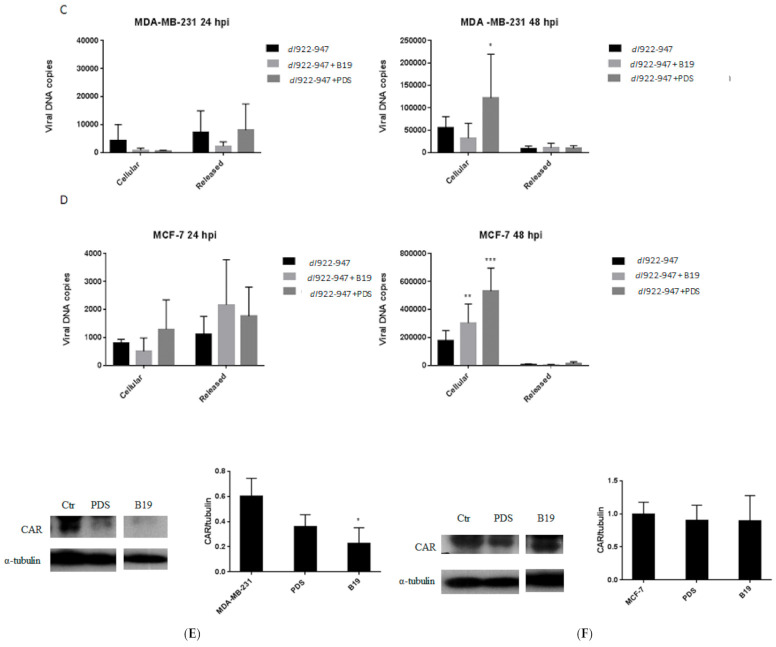
Adenovirus AdGFP entry, dl922-947 replication, and CAR modulation by G4 binders in breast cancer cells. MDA-MB-231 (A) and MCF-7 (B) cells were infected with the non-replicating AdGFP and treated with G4 binders at different times. AdGFP and G4 binders were added concomitantly (24 h after seeding the cells black bars A and B); or AdGFP was added 24 h after G4 binders (AdGFP was added 48 h after seeding cells, gray bars A and B). GFP emission was evaluated by flow cytometry and flow cytometry profile of a representative experiment is reported. The statistical significance was calculated by GraphPad Prism 7 with two-way ANOVA using Tukey’s multiple comparisons test (** p < 0.0001, * p < 0.05). The statistical significance is indicated in the histograms that represent the mean of at least three independent experiments. To evaluate viral replication, MDA-MB-231 (C) and MCF-7 cells (D) were treated with dl922-947 (at the IC50 value) or AdGFP (30 p.f.u. x cell, used as control at 48 hpi, not shown) in combination with G4 ligands (at their IC50 values). After 24 and 48 h of incubation, supernatants and adherent cells were collected separately to evaluate extracellular release and intracellular viral particles, respectively. Viral DNA was extracted and used to quantify viral titer by Real-Time qPCR. The data represent the mean of three independent experiments (C). Statistical significance was calculated comparing the increased intracellular amplification with respect to the correspondent extracellular fraction (* p < 0.05, ** p < 0.005, *** p < 0.0001). To evaluate CAR modulation by G4 binders, MDA-MB-231 (E) and MCF-7 cells (F) were treated with G4 binders (at the IC50 values) for 48 h. The images represent the expression of CAR evaluated by Western blot. As control, α-tubulin was used. Original blots are enclosed as supplemental Figure S5 for CAR. The histogram reports the mean of two independent experiments. The statistical significance was calculated by parametric paired two tailed T test, by GraphPad Prism 7 (* p < 0.05).


