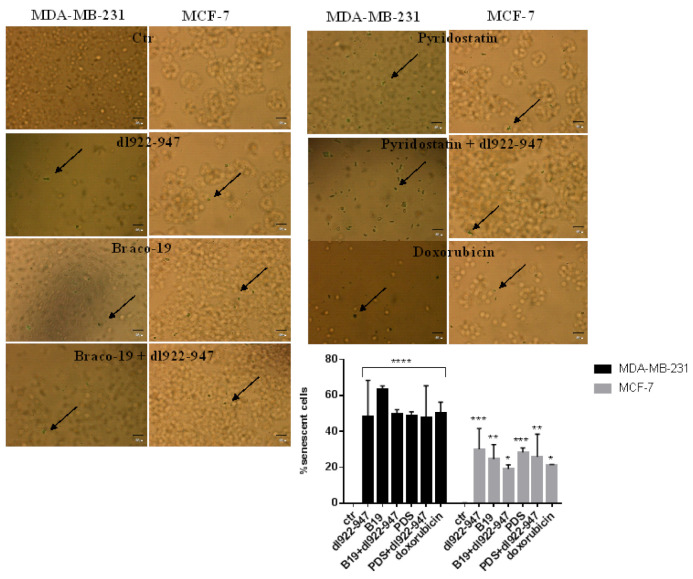
Figure 5.
Induction of cell senescence. MDA-MB-231 and MCF-7 cells were treated for 72 h with dl922-947, G4 binders, or their combination at the IC50 values. Senescent cells are indicated in the images by the arrows as blue SA-b-Gal positive stained cells. Doxorubicin was used as positive control. The images are representative of three independent experiments. The statistical significance indicated in the histograms was calculated by GraphPad Prism 7 with two-way ANOVA with Tukey’s multiple comparisons test (**** p < 0.0001, *** p < 0.001, ** p < 0.01, * p < 0.05).

