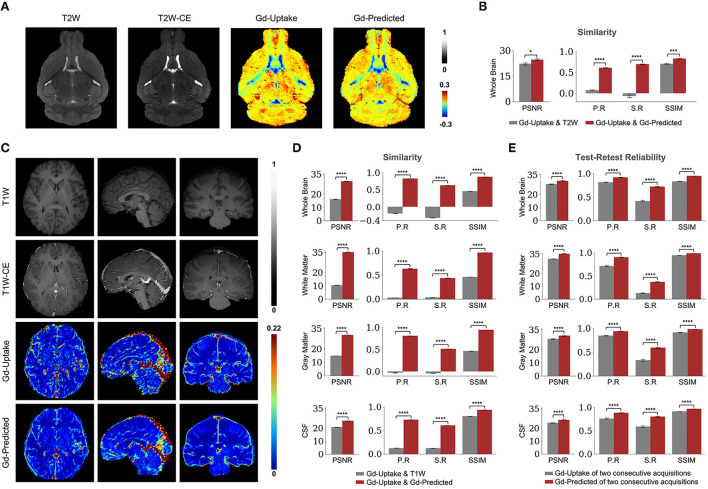
Figure 3.
Quantitative evaluation of the DeepContrast in the healthy mouse and human brains. (A) DeepContrast prediction (Gd-Predicted) highly concords with the ground truth GBCA-uptake map (Gd-Uptake) in the mouse brain. The non-contrast scans and the contrast-enhanced scans are displayed for reference. Color bars indicate the colormap and dynamic range used in the cross-sectional brain images. (B) The similarity between the model prediction and the ground truth, evaluated on all 6 scans in the test set using quantitative metrics, where the non-contrast (T2W) scans are used as the performance baseline. (C) DeepContrast prediction (Gd-Predicted) highly concords with the ground truth GBCA-uptake map (Gd-Uptake) in the cognitive normal human brain. Color bars indicate the colormap and dynamic range used in the cross-sectional brain images. (D) The similarity between the model prediction and the ground truth, evaluated on 179 scans of cognitively normal (CN) participants using quantitative metrics, where non-contrast (T1W) scans are used as the performance baseline. (E) DeepContrast shows higher test-retest reliability than the experimentally acquired Gd-Uptake ground truth. For all voxel-based metrics, only the voxels within the brains or subregions are used. SSIM is calculated on the minimum bounding box of the brains or subregions. Asterisks indicate level of statistical significance (*p < 0.05, **p < 0.01, ***p < 0.001, and ****p < 0.0001). PSNR: peak signal-to-noise ratio; SSIM, structural similarity index; P. R, Pearson correlation coefficient; S.R, Spearman correlation coefficient.

