Figure 4.
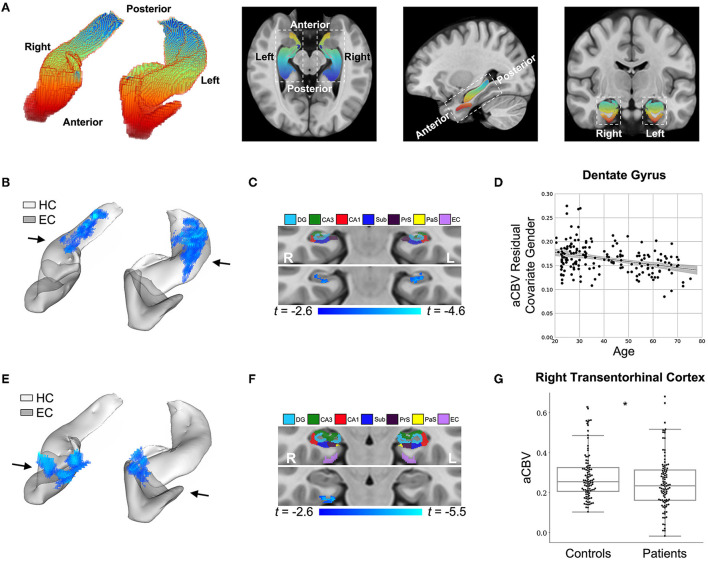
DeepContrast maps differential anatomical patterns of dysfunction in the hippocampal formation. (A) A three-dimensional rendering of the bilateral hippocampal formation (left panel) consisting of the hippocampus (HC) and the entorhinal cortex (EC) and axial, sagittal, and coronal slices from a group-wise T1-weighted MRI template cutting through the hippocampal formation (right three panels). The hippocampal formation is displayed along the anterior-to-posterior axis. (B) A voxel-based analysis of the synthesized CBV maps of 177 individuals ranging from 20 to 72 years of age reveals that the greatest age-related decline occurred in the body of the hippocampal circuit (color-coded by the degree of significance). (C) A coronal slice, onto which the hippocampal formation mask is applied, reveals that age-related decline primarily localizes to the dentate gyrus. The voxel-based analysis is conducted using a multiple regression model in SPM12 using sex as a covariate and age as the regressor, and the age-related differences are contrasted using Student's t test. Multiple comparisons are corrected for, yielding voxel-wise p < 0.005 and cluster-wise p < 0.05 (refer to methods). (D) A scatter plot shows the association between age and mean synthesized CBV values in the dentate gyrus after the removal of gender effects (βage = −6.36e-4, tage = −4.64, page = 6.85e-6). The shaded area surrounding the regression line indicates the 95% CI. (E) A voxel-based analysis of the synthesized CBV maps of 50 Alzheimer's disease (AD) patients compared with 50 age-matched normal controls, each with two back-to-back scans, reveals AD-related reduction in the entorhinal cortex (color-coded by the degree of significance). (F) A coronal slice, onto which the hippocampal formation mask is applied, reveals that AD-related decline localizes primarily to the transentorhinal cortex. The voxel-based analysis is conducted using a multiple regression model in SPM12 using age, sex, and participant identity as covariates and diagnostic class (i.e., cognitive normal vs. dementia) as the regressor and the AD-related difference are contrasted using Student's t-test. Multiple comparisons are corrected for, yielding voxel-wise p < 0.005 and cluster-wise p < 0.05 (refer to methods). (G) A box plot showing individual-participant mean synthesized CBV values in the right transentorhinal cortex indicates a significant difference between patients with Alzheimer's disease and healthy controls (two sample t-test one-tailed p = 0.031). Center line: median; box limits: upper and lower quartiles; whiskers: 1.5× interquartile range; points: outliers. HC: hippocampus; EC: entorhinal cortex; DG: dentate gyrus; CA3: cornu Ammonis 3; CA1: cornu Ammonis 1; Sub: subiculum; Prs: presubiculum; PaS: parasubiculum.

