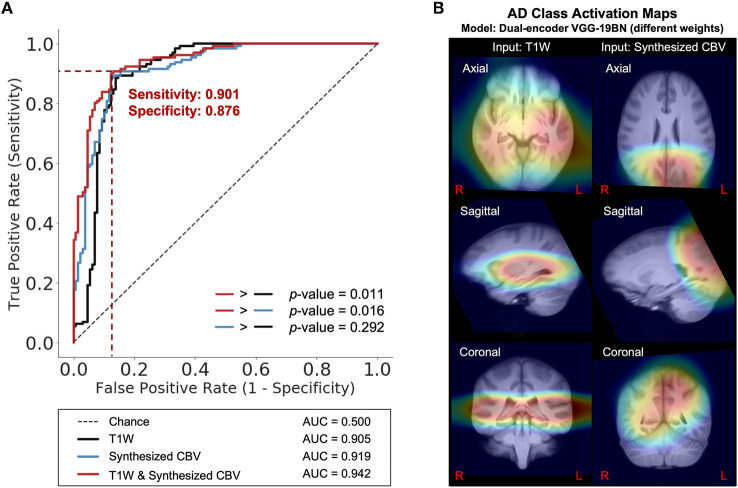
Figure 7.
DeepContrast-generated synthesized CBV improves AD classification and provides spatially-meaningful information. (A) Receiver Operating Characteristics curves for the classification models using T1W structural data only (black), using synthesized CBV functional data only (blue), or using both in combination (red). p-values were calculated using DeLong's test. (B) The class-average Class Activation Maps of the best-performing model, calculated from 131 AD scans in the standalone test set.

