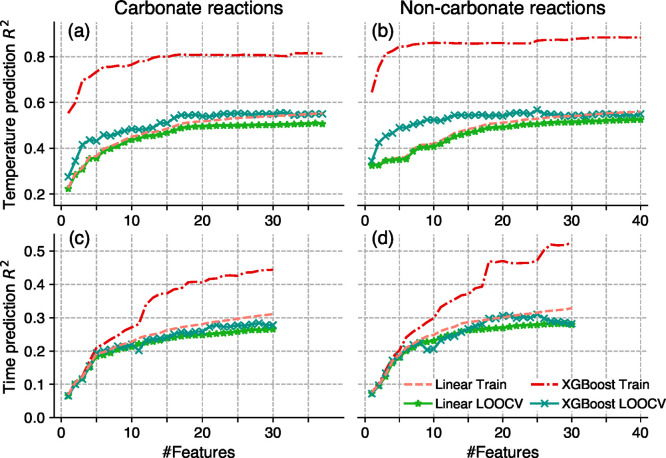
Figure 5.
Model performance versus number of training features for both linear and nonlinear (gradient boosting tree regressor) models. The x-axis shows the number of features used. The features are added in the order of DI value rankings. The first row shows performances of temperature prediction models trained on carbonate reactions (a) and noncarbonate reactions (b). The second row shows performances of time prediction models trained on reactions with (c) and without (d) carbonate precursors.

