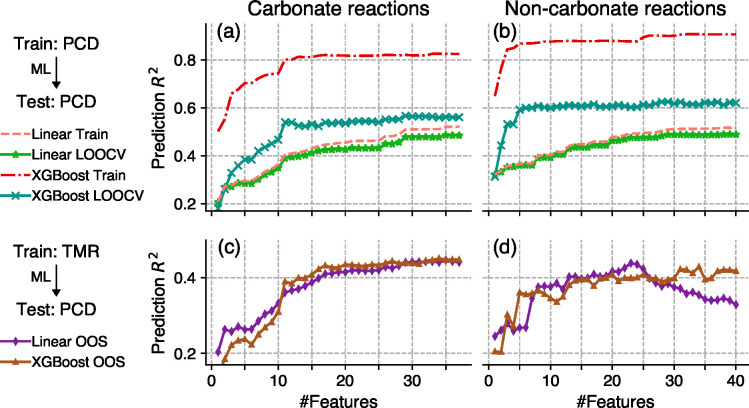
Figure 7.
Performance of the models versus the number of features evaluated on the PCD data set. X-axes show the number of features used in each model. Features are added in the order of DI value rankings as in Figure 2. The left panels (a) and (c) show models trained on carbonate reactions, and the right panels (b) and (d) show models trained on noncarbonate reactions. The top panels (a) and (b) show the performance of models trained and evaluated on the PCD data set, which represent the upper bounds of OOS scores (c) and (d), which show performance of the models trained on the TMR data set. A higher OOS score indicates better model generalizability.

