
Figure 8.
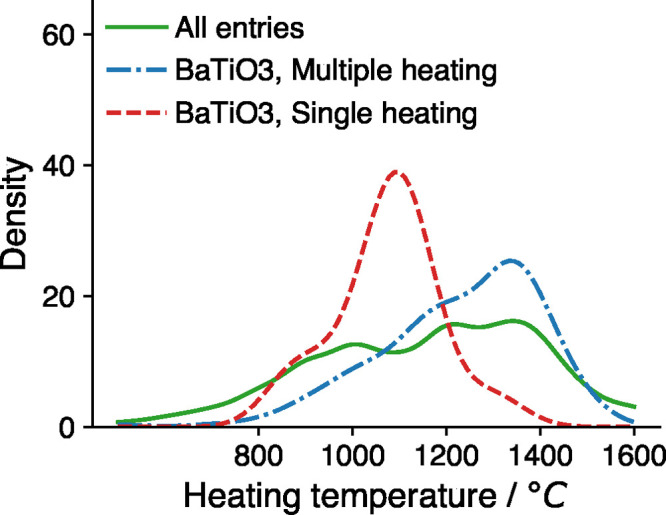
Curves are the estimated distribution of heating temperatures for each group of reactions in the training data set. The dashed/dotted lines show temperature distributions for the reaction TiO2 + BaCO3 → BaTiO3 + CO2 (red dashed line for single-heating reactions and blue dotted line for multiple-heating reactions). Green solid line shows the temperature distribution for the entire data set.