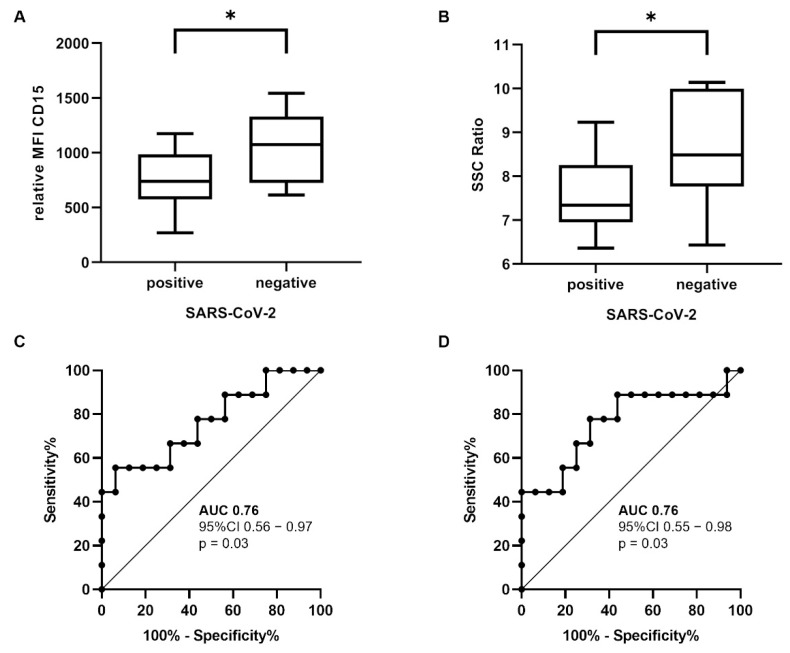
Figure 2.
Immunophenotypic differences of the circulating neutrophil granulocytes. CD15 (A) and SSC ratio (B) were significantly reduced in patients with SARS-CoV-2 infection (difference ± SD; 295.70 ± 117.50 MFI; p = 0.02 and 1.11 ± 0.43 SSC ratio; p = 0.02). ROC curves showed an AUC of 0.76 for the CD15 (C) and SSC ratio (D). Mann–Whitney U test * p < 0.05 (abbreviations: n = number; MFI = mean fluorescence intensity; SSC = side-scatter; SARS-CoV-2 = severe acute respiratory syndrome coronavirus 2; AUC = area under curve; CI = confidence interval; ROC = receiver operating characteristic).

