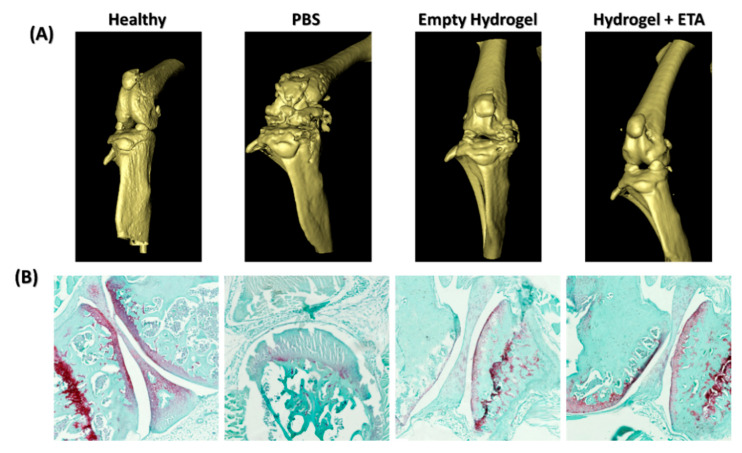
Figure 6.
Representative mouse knee images in µ-CT and histological analysis (A) In vivo µ-CT scans of mouse knee joints showing a 3D view of the cartilage surface. From left to right healthy knee (negative control), OA knee with PBS injection (sham treatment/positive control), OA knee treated with empty hydrogel, and OA knee treated with ETA-loaded hydrogel. (B) Histological staining with Safranin O/Fast Green of sections from healthy, sham-treated, and hydrogel-treated mouse knees.

