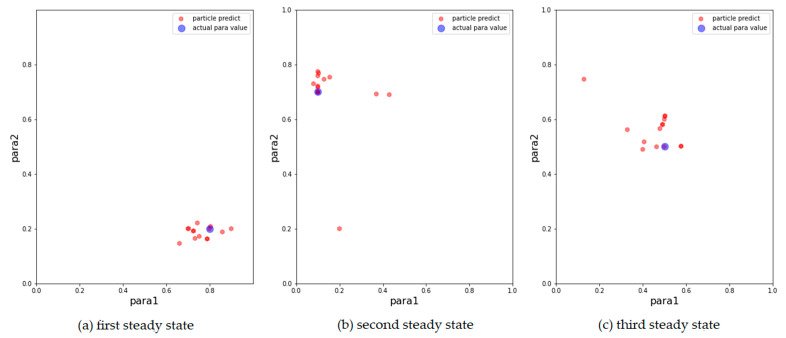
Figure 3.
Results of AH model with 500 particles. The blue points are the parameters that generate synthetic data, the red points correspond to the 15 particles with the largest weight after filtering. (a) Results for the first observation. (b) Results for the second observation. (c) Results for the third observation.

