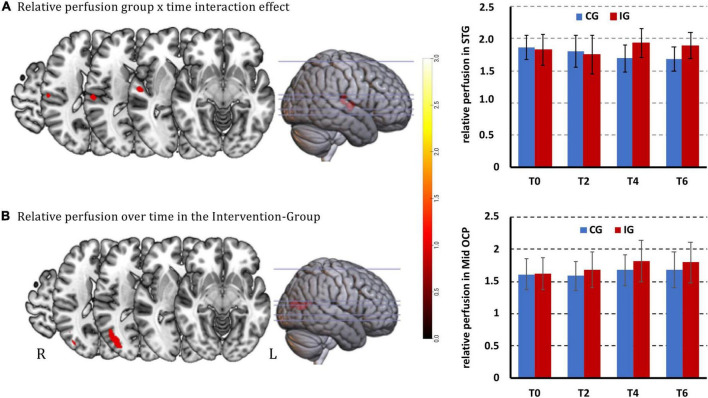
FIGURE 3.
Significant relative perfusion changes [p < 0.001 (uncorrected), cluster level corrected at alpha = 0.05 with cluster size > 41 voxel for cluster-wise FWE]. (A) Increased group × time interaction effect in the right superior temporal gyrus and bar plots of beta values with standard deviations; (B) increased relative perfusion over time in the IG in the right middle occipital region. Clusters are overlaid on the structural MNI template of the brain and bar plots of beta values with standard deviations. The color bar from dark red to light yellow indicates the increasing relative GM CBF values.

