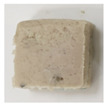
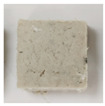
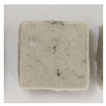
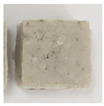
Table 3.
Physicochemical characteristics of surimi with different washing times.
| W0 | W1 | W2 | W3 | |
|---|---|---|---|---|
| Appearance |

|

|

|

|
| Yield (%) | 100.00 ± 0.00 d | 88.58 ± 1.26 c | 82.65 ± 0.89 b | 76.73 ± 0.96 a |
| Color (a*) | 1.44 ± 0.44 a | 0.29 ± 0.49 b | −1.31 ± 0.37 c | −1.08 ± 0.39 c |
| Whiteness | 65.23 ± 1.03 a | 71.97 ± 1.10 b | 72.01 ± 0.89 b | 71.96 ± 0.80 b |
| pH | 6.32 ± 0.02 a | 6.35 ± 0.01 a | 6.66 ± 0.02 b | 6.83 ± 0.02 c |
| TVB-N (mg N/100 g) | 6.57 ± 0.24c | 5.86 ± 0.46 bc | 5.27 ± 0.39 ab | 4.62 ± 0.35 a |
| TBARS (mg/kg) | 0.18 ± 0.00 d | 0.13 ± 0.00 c | 0.12 ± 0.00 b | 0.09 ± 0.00 a |
| Breaking force (g) | 369.67 ± 31.48 a | 403.29 ± 25.94 a | 419.33 ± 19.94 a | 413.67 ± 35.20 a |
| Deformation (cm) | 0.86 ± 0.04 a | 0.92 ± 0.03 ab | 0.97 ± 0.04 bc | 1.00 ± 0.01 c |
| Gel strength (g·cm) | 320.20 ± 38.60 a | 369.89 ± 32.94 b | 408.51 ± 36.03 c | 415.18 ± 35.68 c |
| WHC (%) | 88.46 ± 1.49 a | 90.90 ± 1.39 b | 92.53 ± 2.02 b | 92.87 ± 1.75 b |
Note: Different letters in the same line indicate significant differences (p < 0.05).
