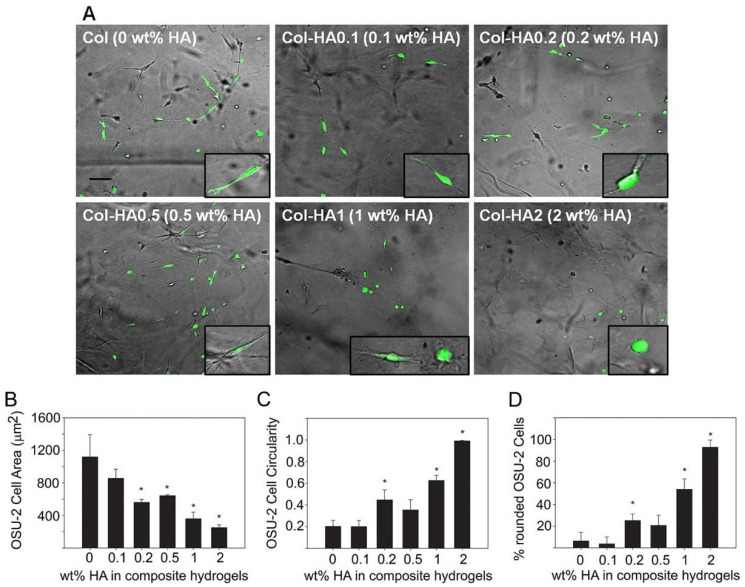
Figure 4.
Glioblastoma cell morphologies and migration when cultured on different substrates. OSU-2 glioma cells were cultured on collagen I and III and HA composite hydrogels with different concentrations of HA. Cell morphologies shown in (A) were quantified via cell area (B), circularity (C), and roundness (D). Increased HA content led to lower cell area but increased cell circularity and roundness. The scale bar in (A) indicates 100 µm, * in (B–D) represents a p-value < 0.05 compared to 0% HA condition. Figure reprinted/adapted with permission from Ref. [171]. Copyright 2013, American Chemical Society.

